
Podcast generated by Notebook LM
While no-code platforms have democratized application development by enabling business developers to build solutions without coding, designing and developing enterprise applications remains a complex endeavor. For most users, spontaneous creation is challenging. Even with intuitive tools, sophisticated use cases demand rigorous analysis, planning, and a structured approach to architecture.
In enterprise information system development, architectural design is indispensable—particularly for complex systems, where it accounts for a significant portion of the project timeline. Moreover, enterprise information architect is not a one-time effort but a continuous process. It serves not only immediate system development needs but also long-term strategic goals, including iterative upgrades, migrations, and scalability.
This article will explore a simplified but practical methodology for Enterprise Architect and adapts it to streamline no-code application development.
Foundational Methodologies for Enterprise Architect
Since the 1970s, enterprise architect has evolved into a specialized field, offering frameworks to manage the complexity of enterprise information systems. While many methodologies originated in defense, aerospace, or government sectors, they have been refined for corporate use. Two prominent examples—the Zachman’s Framework and TOGAF—illustrate this evolution.
Zachman’s Framework
Introduced by John Zachman in 1987, the Zachman’s Framework organizes information system architecture into a matrix of five stakeholder perspectives (Planner, Owner, Designer, Builder, and Subcontractor) and six interrogative dimensions (What, How, Where, Who, When, and Why). This structure ensures comprehensive alignment across organizational layers and roles.
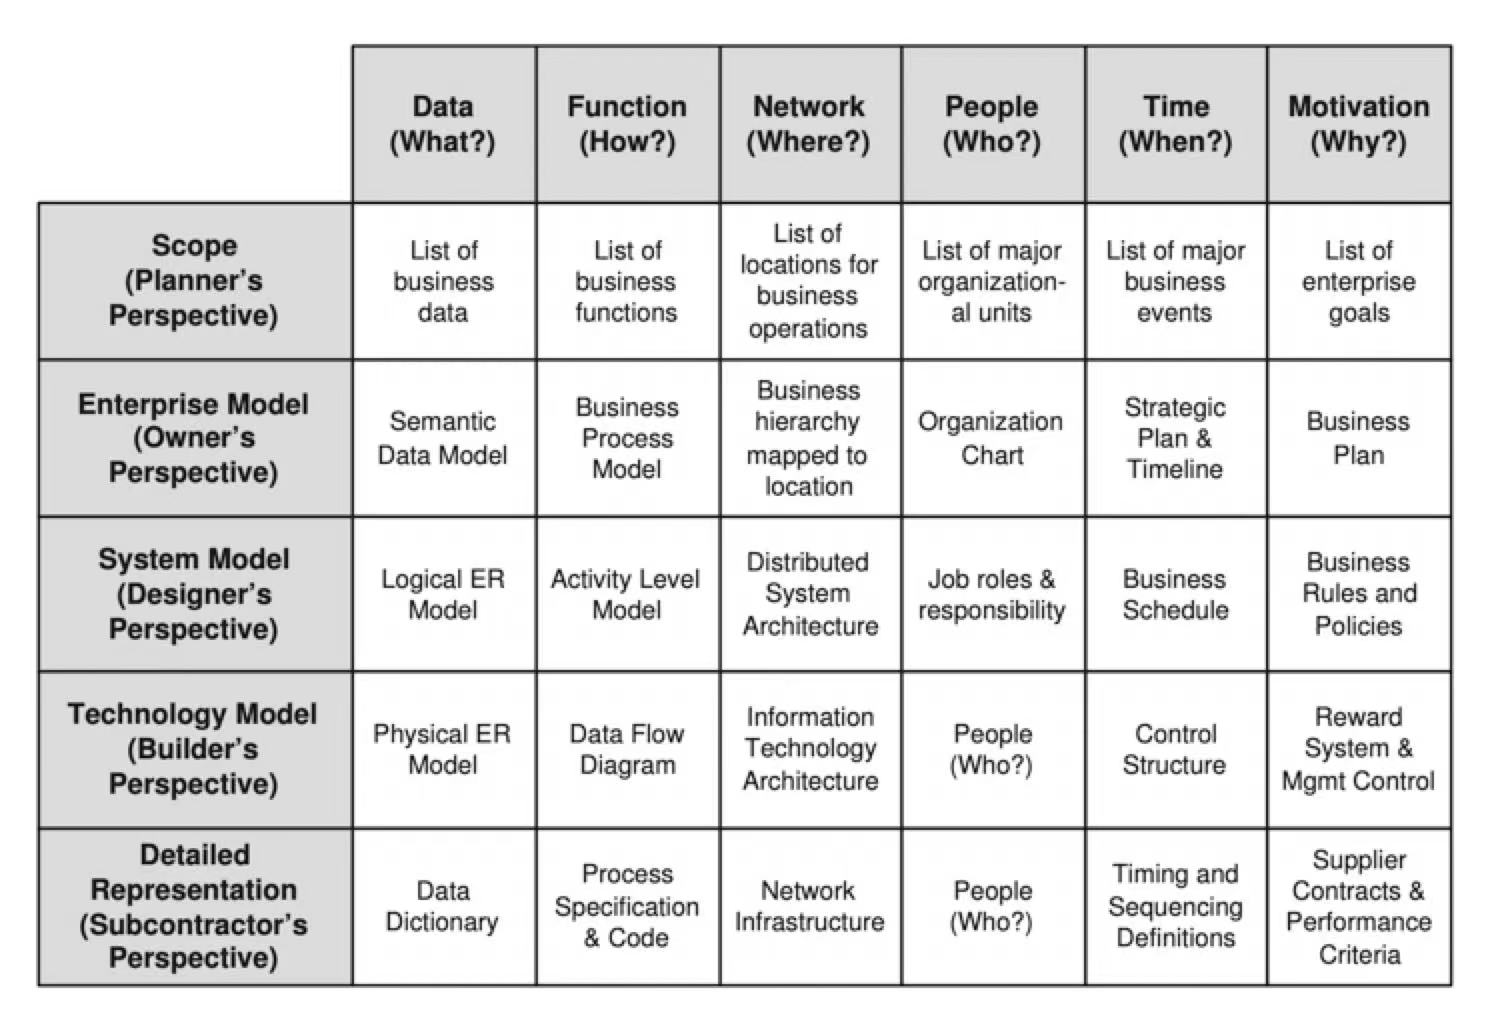
While the framework’s granularity minimizes critical oversights, its 30-cell matrix can create excessive complexity for businesses. Few organizations adopt it wholesale; instead, many treat it as a checklist to validate roles, responsibilities, and design considerations during planning.
The Open Group Architecture Framework (TOGAF)
Managed by The Open Group, TOGAF is the most widely recognized enterprise architecture framework. It divides enterprise architecture into four domains:
- Business Architecture: The business strategy, governance, organization, and key business processes.
- Data Architecture: The structure of an organization’s logical and physical data assets and data management resources.
- Application Architecture: A blueprint for the individual applications to be deployed, their interactions, and their relationships to the core business processes of the organization.
- Technology Architecture: The logical software and hardware capabilities that are required to support the deployment of business, data, and application services. This includes IT infrastructure, middleware, networks, communications, processing, and standards.
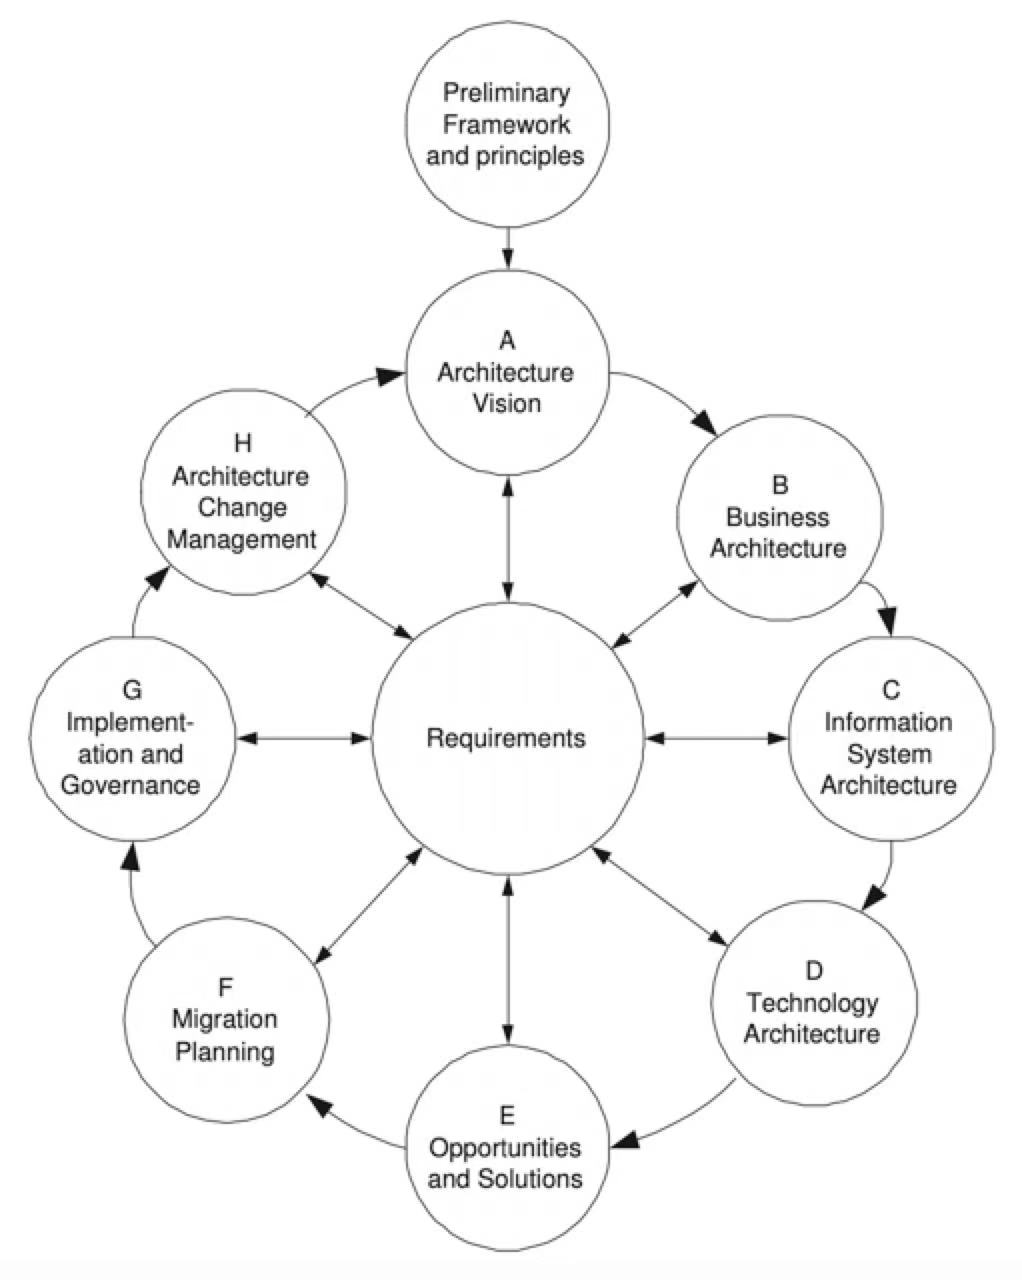
The key to TOGAF remains a reliable, practical method – the TOGAF Architecture Development Method (ADM) – for defining business requirements and developing an architecture that meets those requirements, applying the elements of TOGAF and other architectural assets available to the organization. Under the Preliminary Framework and Principles, ADM starts with an Architecture Vision, proceeds through Business Architecture planning, defines Information System Architecture and Technology Architecture, and then, based on existing information foundations, proposes Opportunities and Solutions for enterprise information construction and adaptive transformation. The Migration Planning prioritizes different projects within the implementation plan, assessing dependencies, migration costs, and benefits, and forms a concrete implementation plan. Implementation Governance provides recommendations for various implementation projects, establishing architectural specifications to manage all implementation and deployment processes, ensuring consistency between the implementation project architecture and related project architectures. Architecture Change Management focuses on the evolution and development of business objectives, environment, and technology, determining whether to initiate and plan new architecture evolution cycles.
TOGAF is currently the most renowned framework in the enterprise architecture domain, with a well-established training and certification system. Despite its rigor, TOGAF’s complexity often renders it impractical for direct implementation. Like the Zachman Framework, it has become a specialized profession rather than a hands-on toolkit for most organizations.
To bridge the gap between theoretical frameworks and practical no-code projects, a streamlined approach is on the wishlist. The following section will introduce a simplified enterprise architect methodology. This simplified methodology retains the strategic perspective of traditional enterprise architect but prioritizes agility and accessibility.
A Simplified Enterprise Architect Framework (RPIC)
Introducing methodologies often risks descending into abstract procedural jargon. To avoid this pitfall, we ground our explanation in a relatable business scenario. Before diving into the case study, however, let’s outline the core principles of RPIC.
RPIC stands for Role, Process, Information, and Content. It is a step-by-step analytical and planning process that begins by breaking down the roles involved in the management and operations. Map the processes and data objects for each role (which may include external roles) interacts with, and synthesize these insights into actionable blueprints for data architecture, role permissions, reporting, and workflow design. By systematically aggregating and deduplicating these elements, organizations gain clarity on these four foundational pillars: data, role, process and report.
These four components deliver concrete outputs that guide IT projects—whether configuring off-the-shelf systems, custom development, or no-code application building—with precision. Its simplicity enables even non-technical professionals to collaborate effectively, accelerating implementation while minimizing ambiguity. However, RPIC is intentionally simplified. It excludes certain aspects, such as strategic perspectives, long-term planning horizons, and application iteration and migration plans—to maintain agility. These elements remain critical but are addressed through complementary frameworks when necessary.
Case Study: Applying RPIC in Action
Case Background
The subject of this case is Pudu Catering, a growing company specializing in corporate catering services. The company provides daily employee meal delivery and event catering (e.g., conferences, meetings) to businesses. Its emphasis on culinary quality and flavor has earned loyalty from high-benefit employers. Many customers maintain year-round contracts for breakfast and lunch services, often extending to event catering—a significant customer overlap between these two business lines.
Pudu’s menu combines a la carte dishes and set meals. Employees typically choose from dozens of daily set meals, while event customers opt for either curated set meals or custom menus. Most customers prefer standardized sets for convenience.
In its early stages of development, Pudu currently operates with one production and processing center. To control costs, Pudu operates with minimal inventory. Beyond packaging materials, it holds no fresh ingredient stock. Instead:
- Purchase: Ingredients are ordered nightly based on the day’s customer orders.
- Production: All meals are prepared at a production and processing center.
- Supplier Relationships: Pudu sources ingredients from a small, fixed group of fresh produce suppliers, settling payments monthly.
- Logistics: Delivery is outsourced to a third-party partner, which invoices Pudu monthly based on actual shipping costs.
Case Objectives
Based on the background provided, this project focuses on designing the information architecture for Pudu’s core business system—spanning order intake, meal production, delivery, and payment reconciliation, and implementing the entire application on a no-code platform. Administrative, HR, and marketing functions are excluded to simplify the case.
The specific deliverables include:
- Data Structure Definition
- Workflow Blueprint
- Functional Application
- User Documentation
Architecture Design
Overview of the Value Creation Process
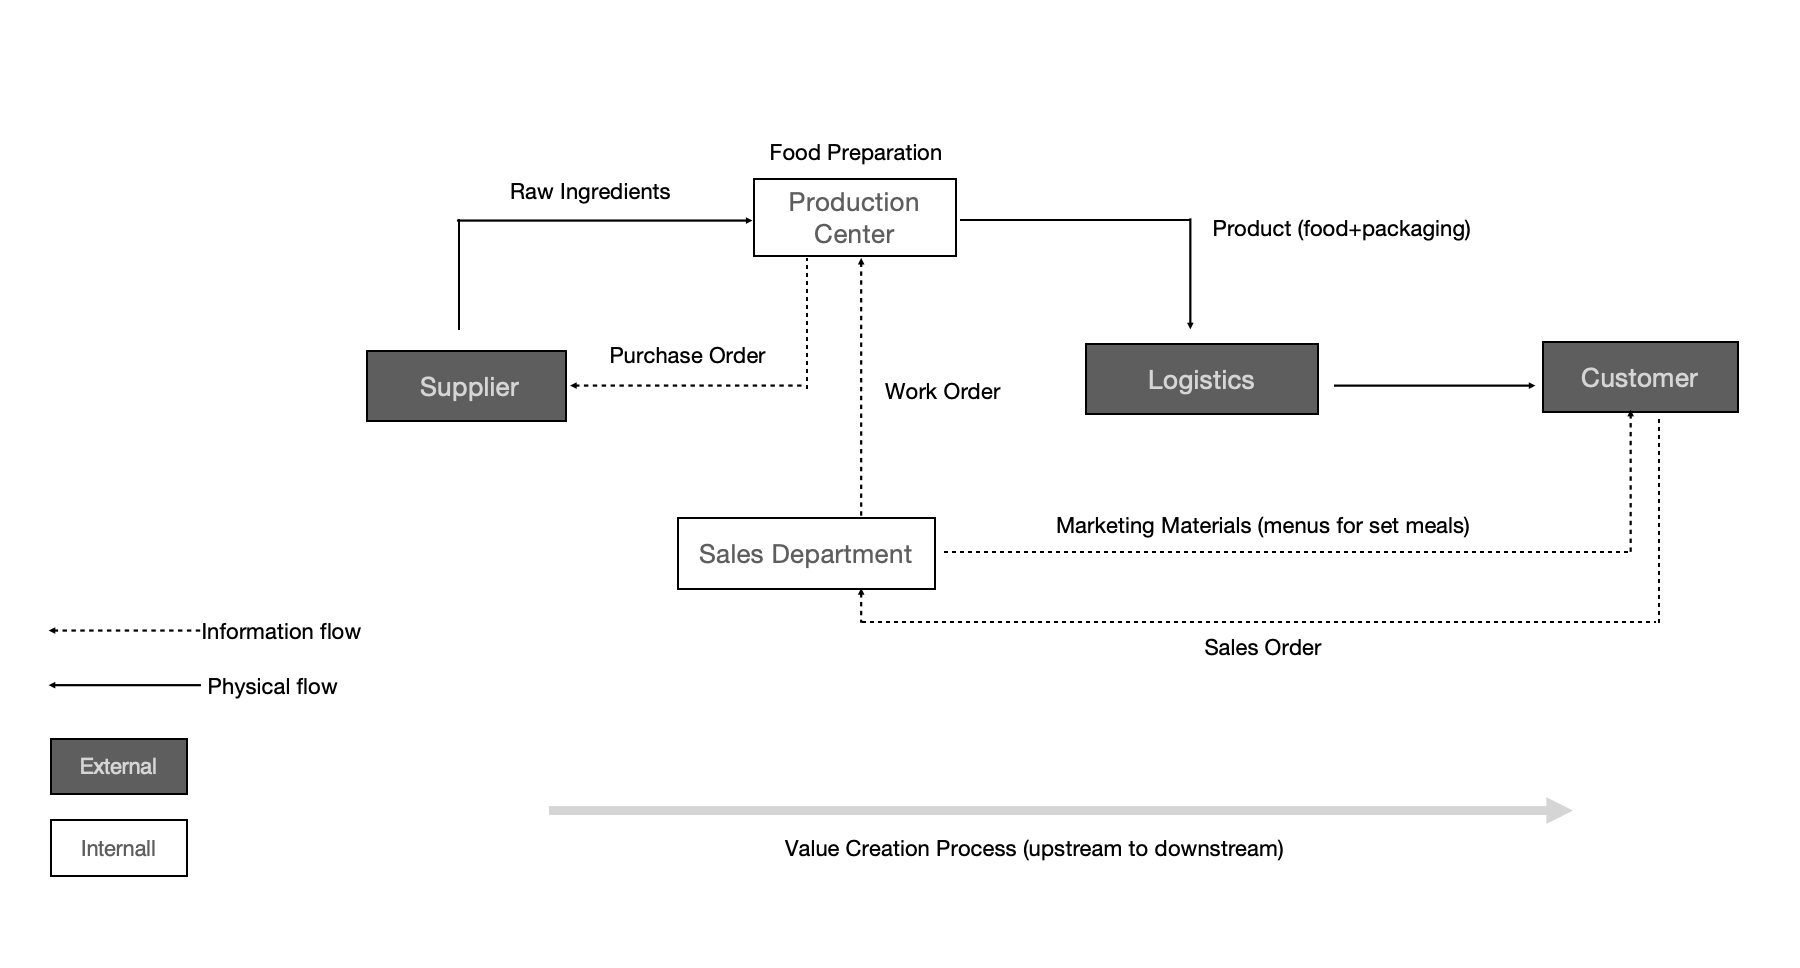
To clarify an organization’s information architecture needs, start by mapping its value creation process—a macro-level flowchart that visualizes how value flows across stakeholders. Nodes represent participating entities (internal departments or external partners), and arrows illustrate value movement from left to right, minimizing complexity while ensuring all critical roles are captured. Roles, the foundation of the RPIC method, must be comprehensively identified to avoid gaps in process coverage.
In this case:
- Information Flow (Dashed Lines):
- Customers place orders with the Sales Department.
- Sales submits work orders to the Production Center.
- The Production Center generates purchase orders for suppliers.
- Physical Flow (Solid Lines):
- Suppliers deliver ingredients to the Production Center.
- Meals are produced and shipped to customers via logistics service providers.
While physical flows are operational necessities, the architecture prioritizes information flows and their associated roles.
From the flowchart, we have identified the following participating roles:
- Sales Department
- Production Center
- Customers (External)
- Fresh Ingredient Supplier (External)
- Logistics Service Provider (External)
Internal roles (e.g., Sales, Chef Assistant) are defined by specific functions, while external roles (e.g., Suppliers, Logistics Service Provider) are treated as singular entities interfacing with designated internal teams.
With this analysis in place, we will now systematically clarify all roles involved in the processes, ensuring a comprehensive understanding of their responsibilities and interactions within the value chain.
Roles Identification
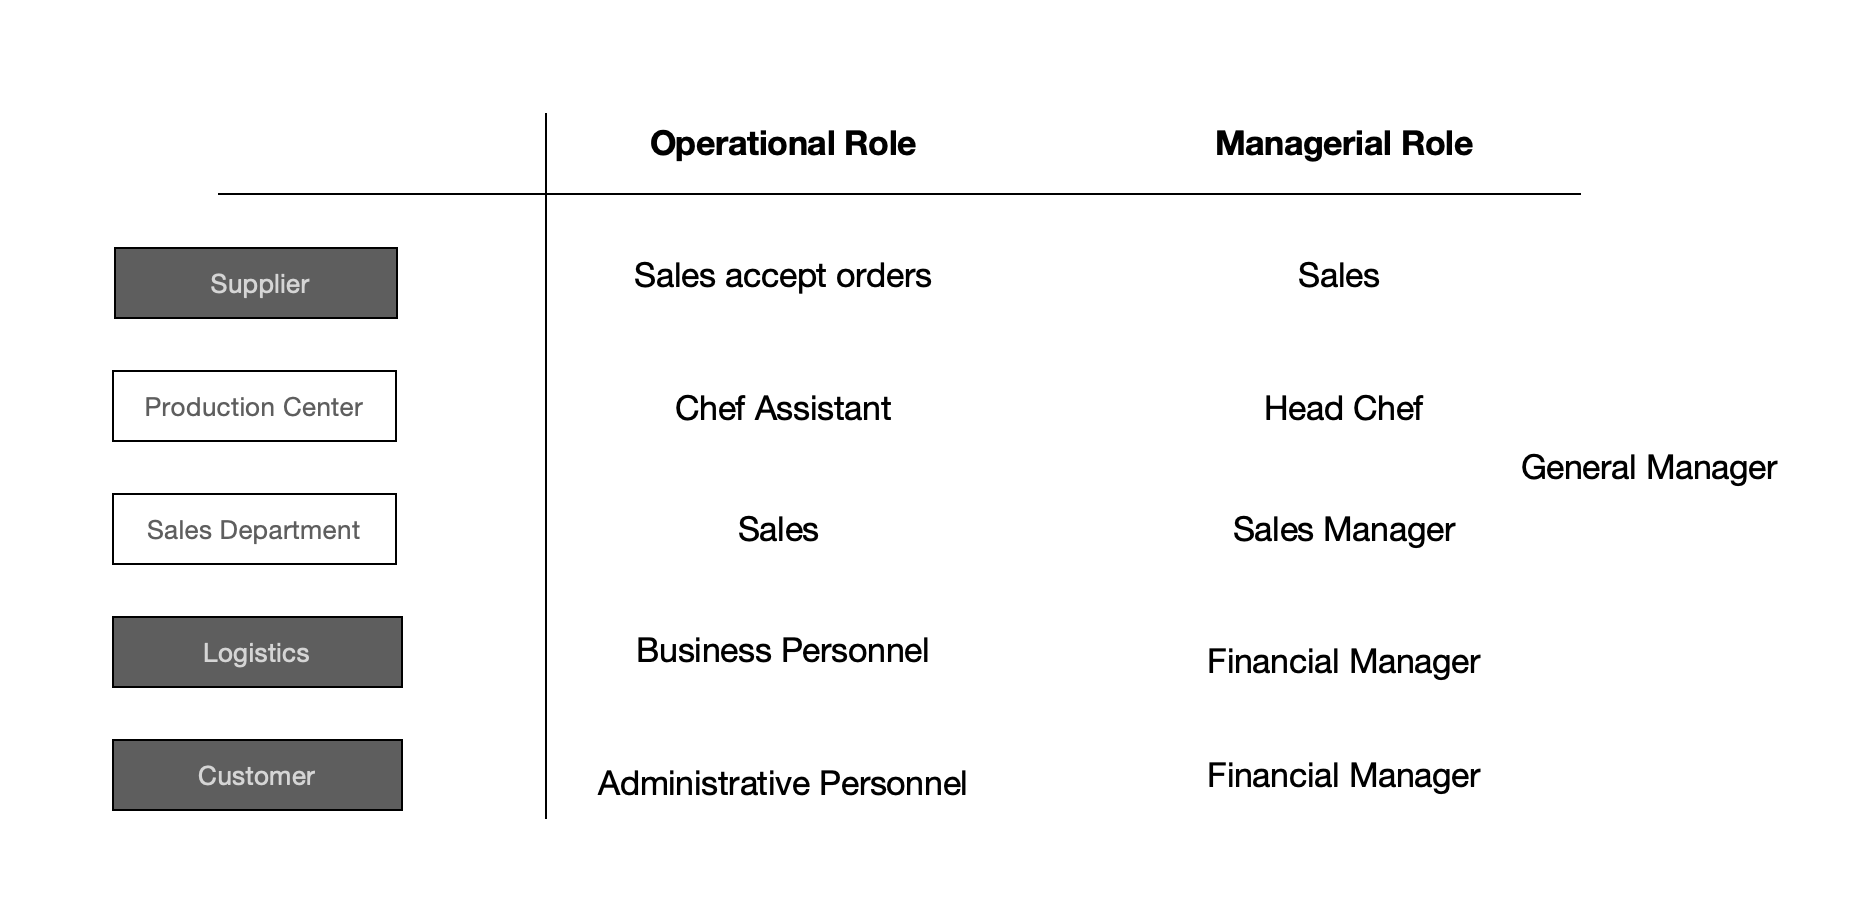
From the overview flowchart, we have identified the roles involved in the business activities, which can be categorized into operational and managerial tiers to reflect hierarchical responsibilities and data access needs.
The table below expands on the list of roles based on the primary entities involved. For simplicity, this case focuses on two functional departments and the role of general manager. This provides the starting point for RPIC—Role (R). Subsequent efforts will revolve around the perspectives of these roles. Interviews or observational studies with these roles can further refine requirements.
Mapping Role-Specific Information and Process Touchpoints
Using three roles—Sales, Chef Assistant, and General Manager—we illustrate how to identify data objects and process interactions:
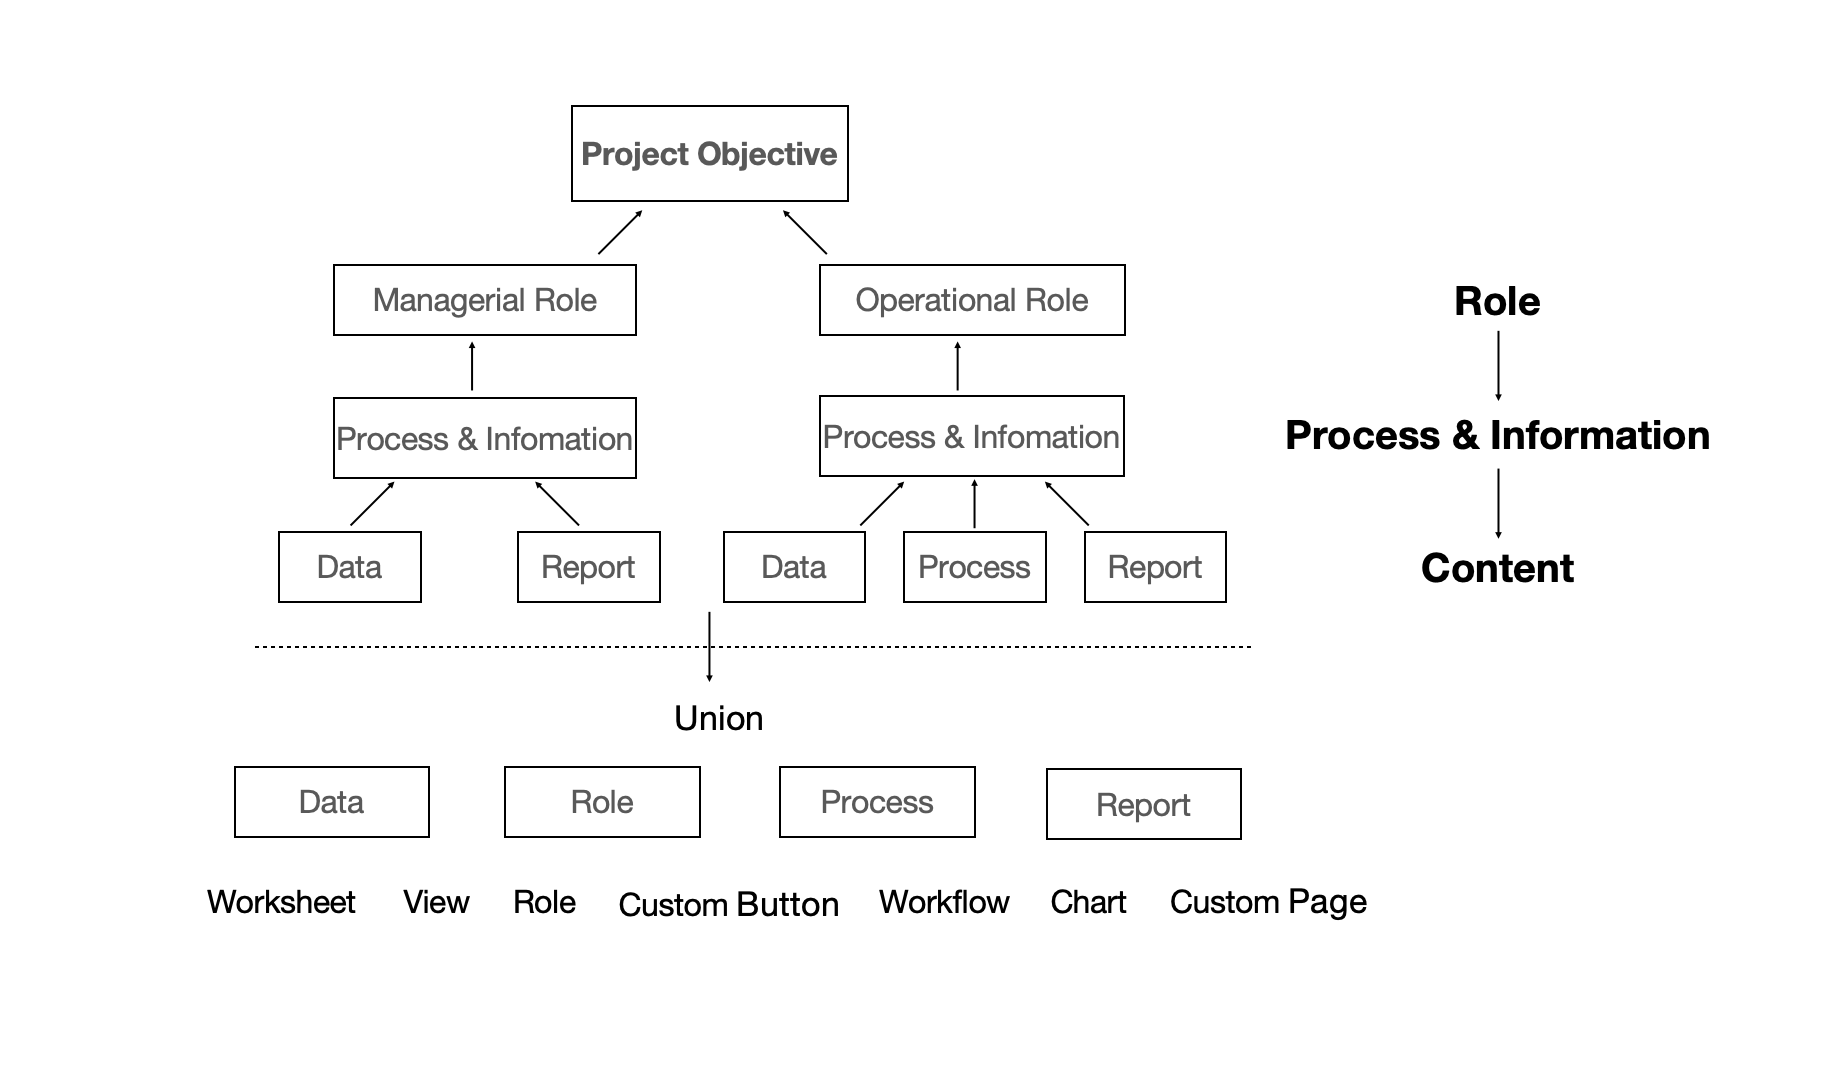
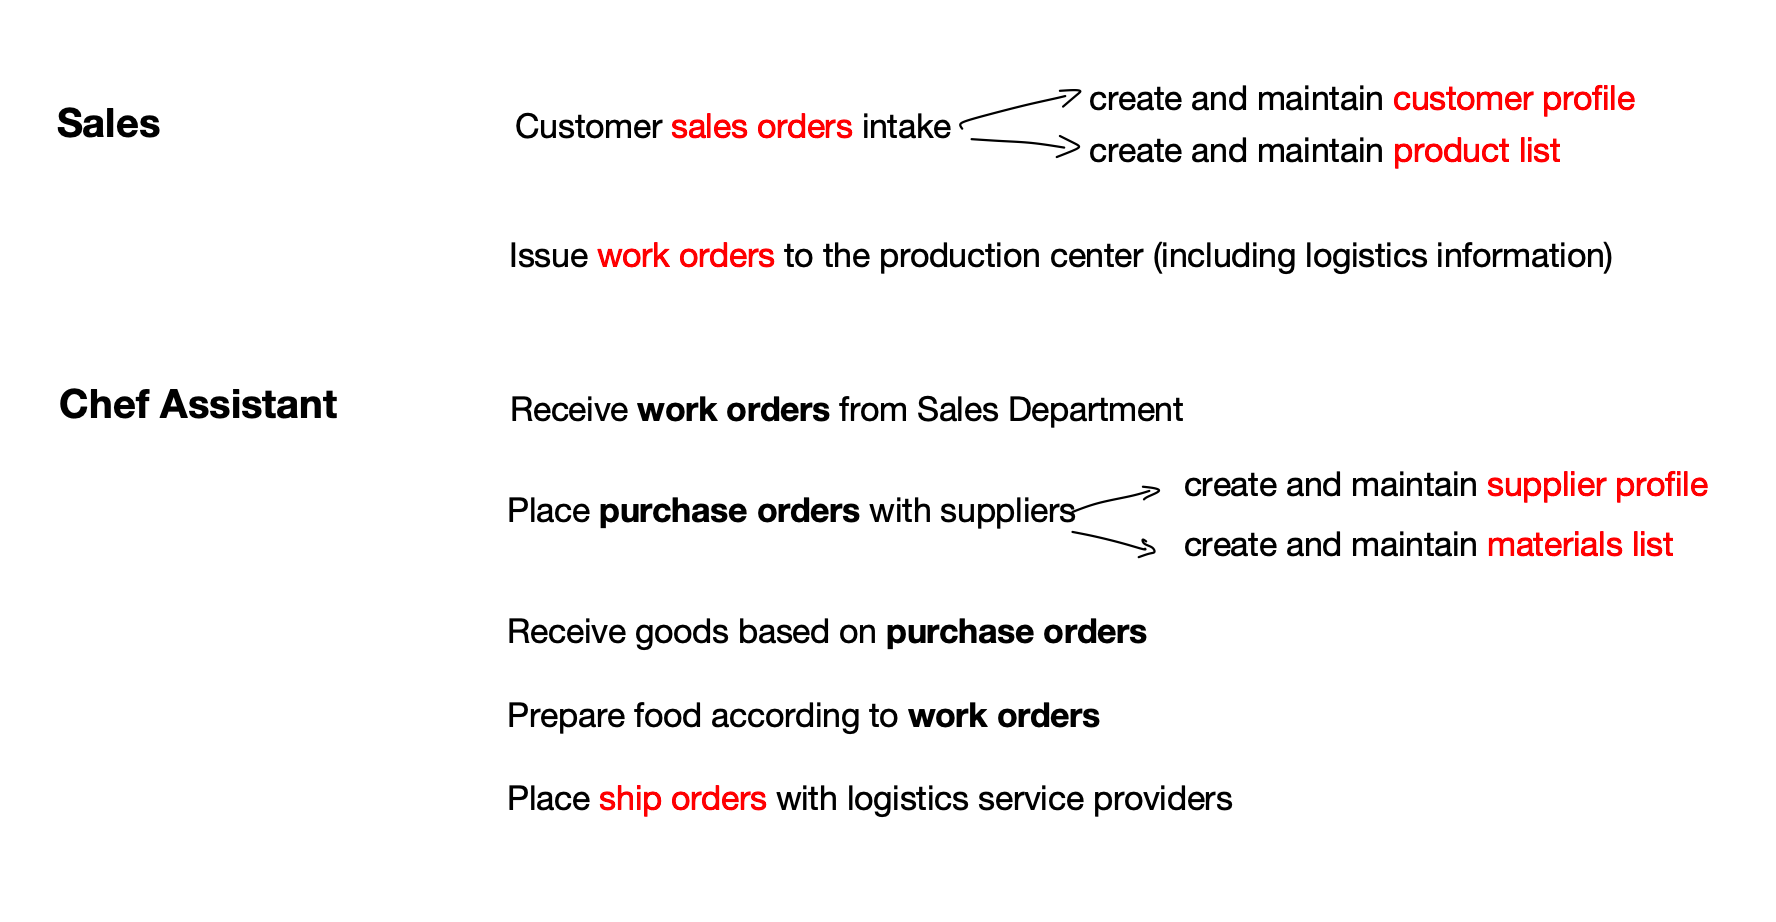
Sales and Chef Assistant are operational roles. Their data and process touchpoints are often concrete, involving the collection and entry of raw data, as well as initiating specific business activities. The Sales’ key business activity is accepting sales orders and issuing work orders to the production center. Further analysis reveals that handling customer orders inevitably requires establishing and maintaining two related data objects: customer profiles and product lists. Without these, orders cannot be effectively created (e.g., customer information should not be repeatedly entered across multiple orders, nor should product details be redundantly included in each order). This deeper analysis is represented by the extended arrows in the diagram below. In the diagram, bold and red text highlights the identified business data objects, which correspond to the I (Information) in the RPIC.
By analyzing role-specific needs, we derive the following core data objects:
- Sales Order
- Customer
- Product List
- Work Order
- Supplier
- Material
- Purchase Order
- Ship Order
In addition to these two operational roles, let’s analyze a managerial role—the General Manager.
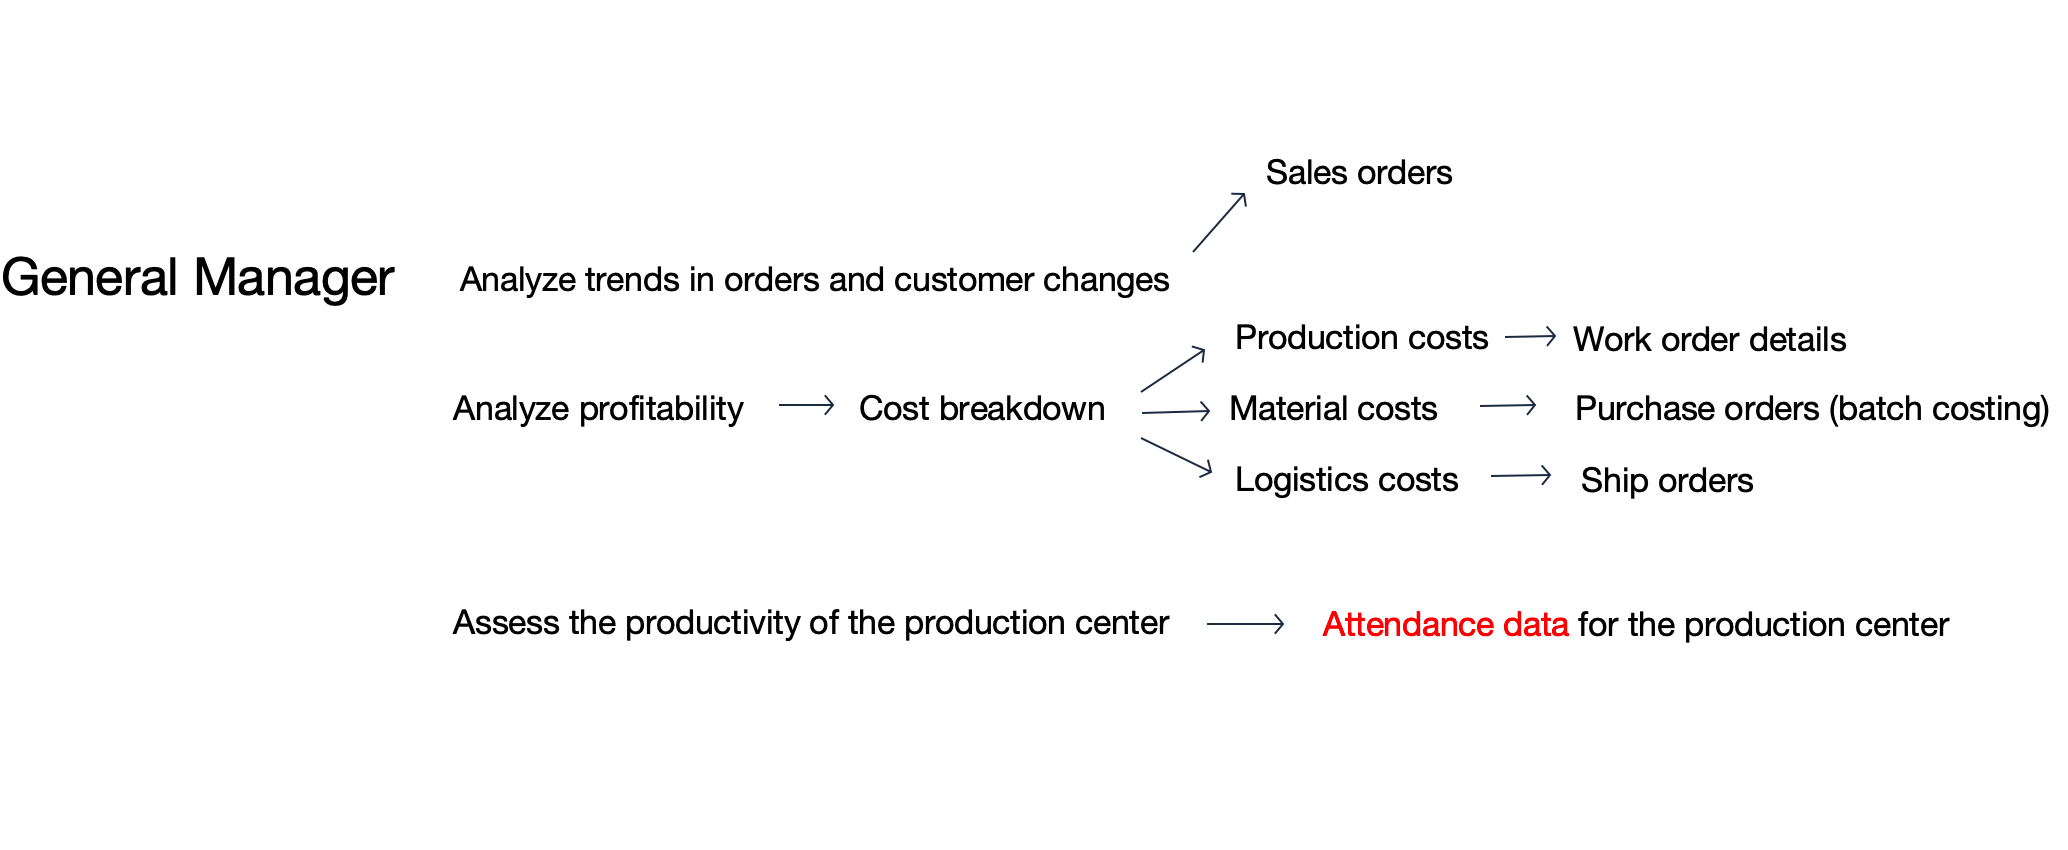
As shown below, the General Manager may want to analyze order trends as well as profitability. Both of these analyses rely on the foundational data managed by operational users, so no additional data objects need to be introduced.
However, the managerial perspective may reveal gaps in the existing data architecture. For example, if the General Manager wishes to assess processing center productivity, attendance data needs to be integrated.
Costing Context: Pudu uses batch costing, linking meal production costs directly to ingredient procurement batches, simplifying financial reconciliation.
By analyzing the business activities of each role, we have mapped out the data and processes they interact with, illustrated in the figure below:
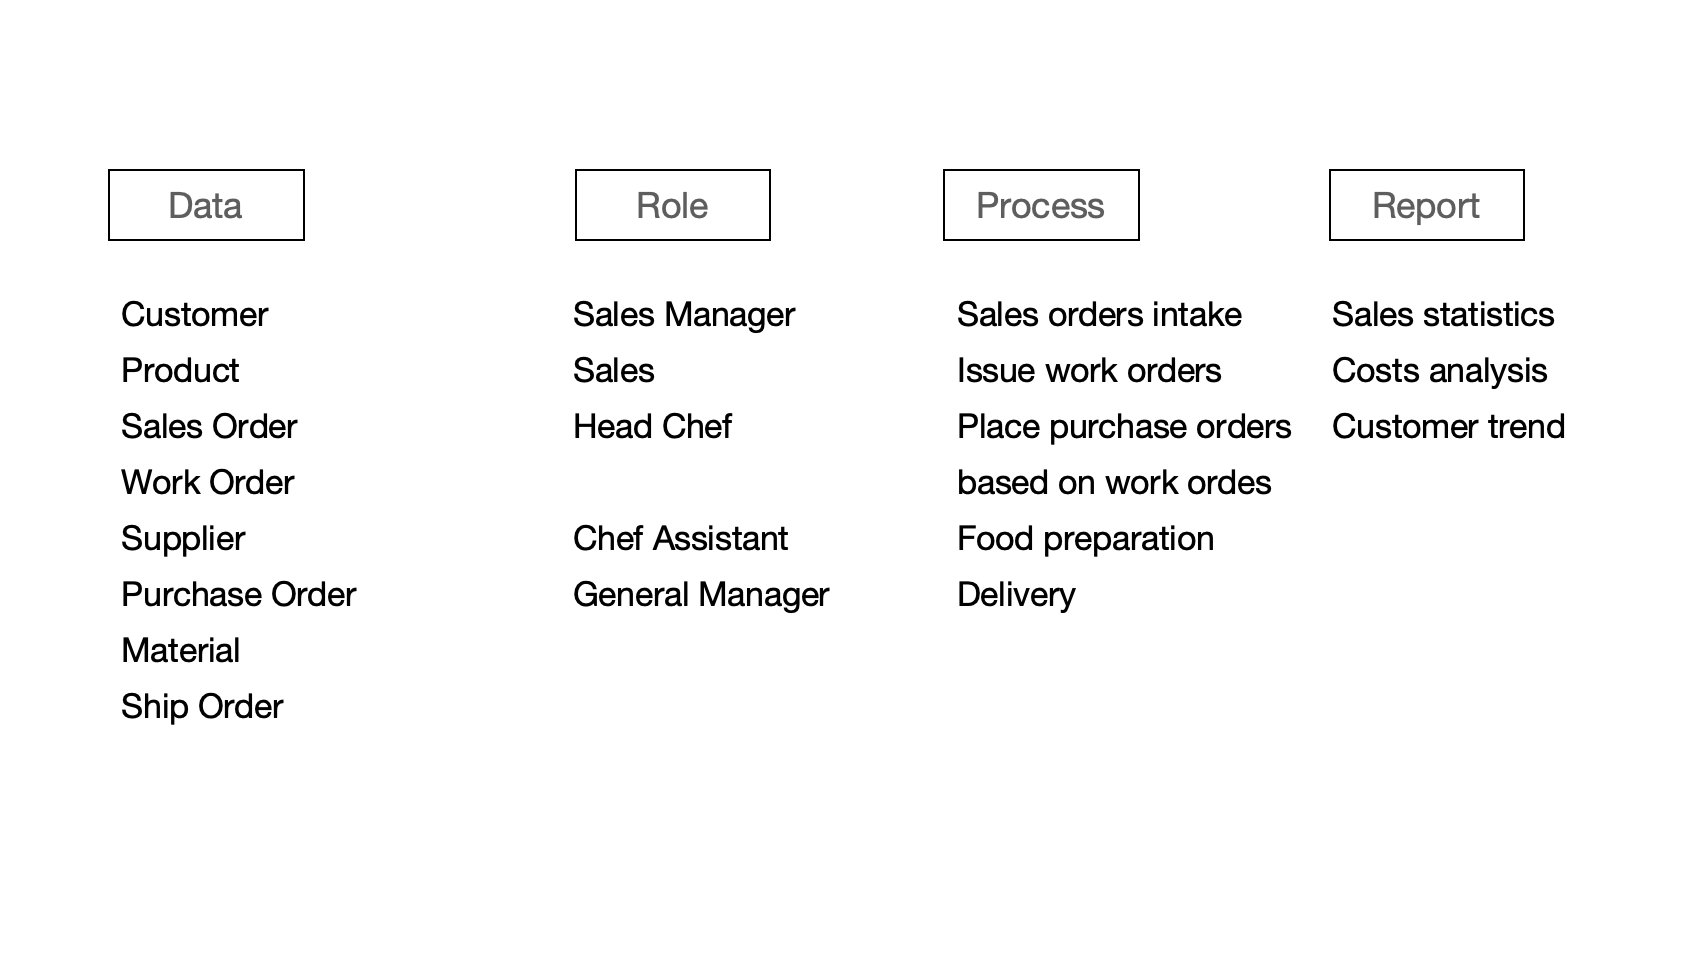
Next, we will further refine the Process and Information components of the RPIC.
Refine Data Model with ER Diagram
Building on the data objects identified, we now define their attributes—the fields that describe each data object. Attributes can be derived from materials of existing processes (e.g., IT system interfaces, Excel files, or paper forms) or through functional users interviews.
Below, we provide a list of data objects and their attributes relevant to this case. For clarity, we use an Entity-Relationship (ER) Diagram to represent these relationships. While ER diagrams follow technical conventions, their core principles are accessible even to non-technical teams:
- Objects as Tables: Each business object (e.g., Customer, Order) is represented as a table, corresponding to a table in a relational database. Objects of the same nature must be grouped into a single table. For example, we cannot have separate tables for “Customers” and “VIP Customers”.
- Attributes as Fields: List descriptive fields within each entity (e.g., Customer Name, Order Date). While formal application development includes field types and keys (primary/foreign), no-code platforms abstract these complexities.
- Relationships as Connectors: Use connecting lines to establish relationships between different tables. Relationships can be one-to-one, one-to-many, or many-to-many. For example, in this case, the relationship between Customers and Orders is one-to-many, while the relationship between Order Details and Product List is one-to-one.
- Layout for Clarity: Arrange the ER diagram so that related objects are positioned near each other, making the relationships easier to understand.
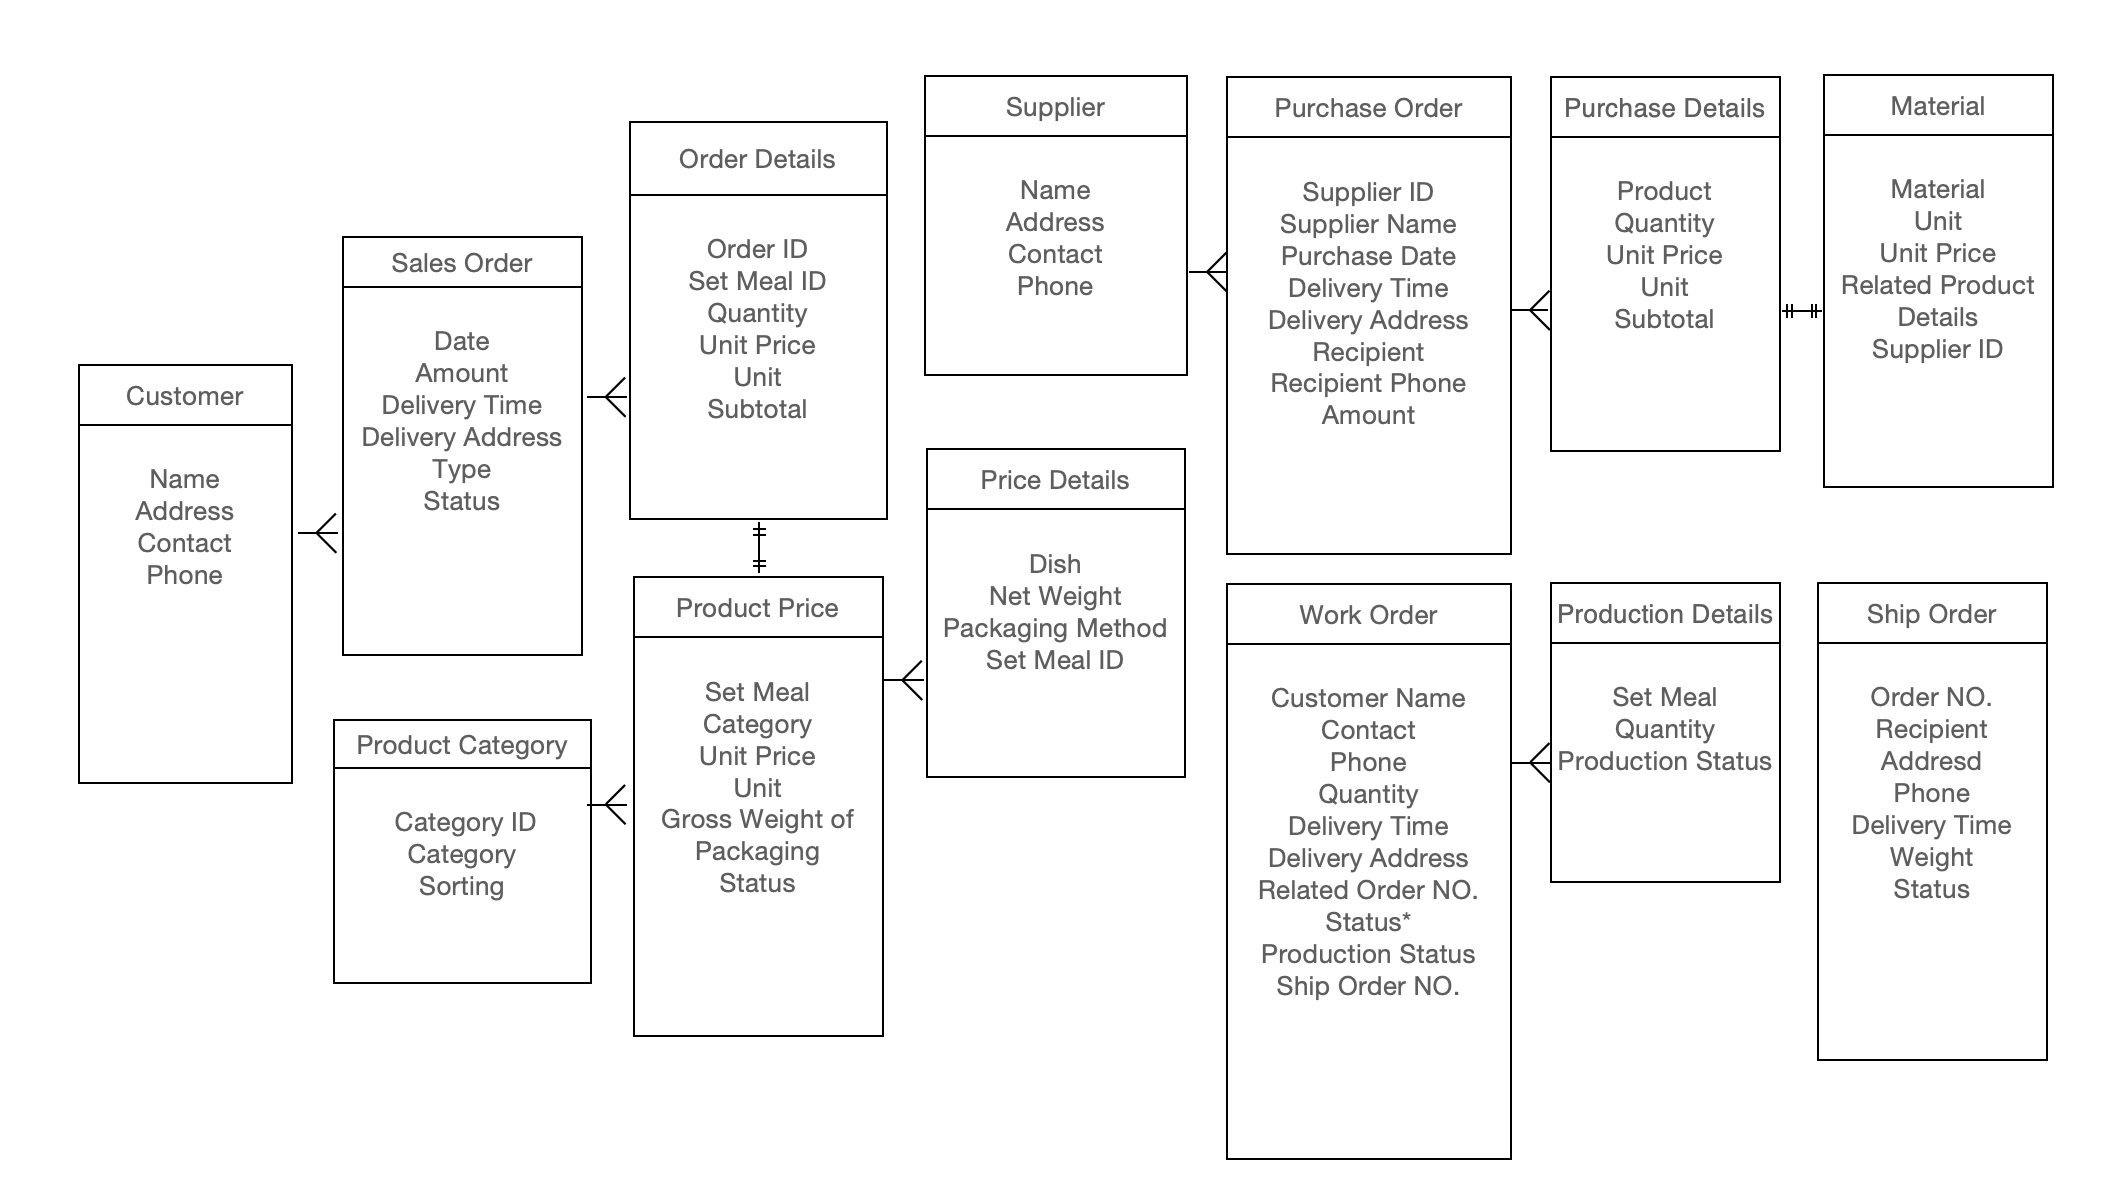
Beyond the initial eight data objects, five more emerged to enhance flexibility: Product Category, Order Details, Price Details, Purchase Details, and Production Details. For example, without Order Details, each order could only include one product—a clear inefficiency. The Product Category is introduced to allow customers to easily browse products by category, such as cold dishes, hot dishes, breakfasts, and set meals.
While ER diagrams are a powerful tool, they are not the only way to design data structures. For simpler data relationships, using tables with annotations can also suffice. Regardless of the method used, the data objects derived from the analysis will directly correspond to the worksheets when building applications on a no-code platform.
Modern enterprises rarely need to reinvent the wheel: Established data models from CRM, ERP, or PSA systems (e.g., Salesforce, Microsoft Dynamics) offer proven blueprints. HAP, for instance, mirrors these frameworks in its prebuilt sales management templates.
Mapping Business Processes with Flowchart
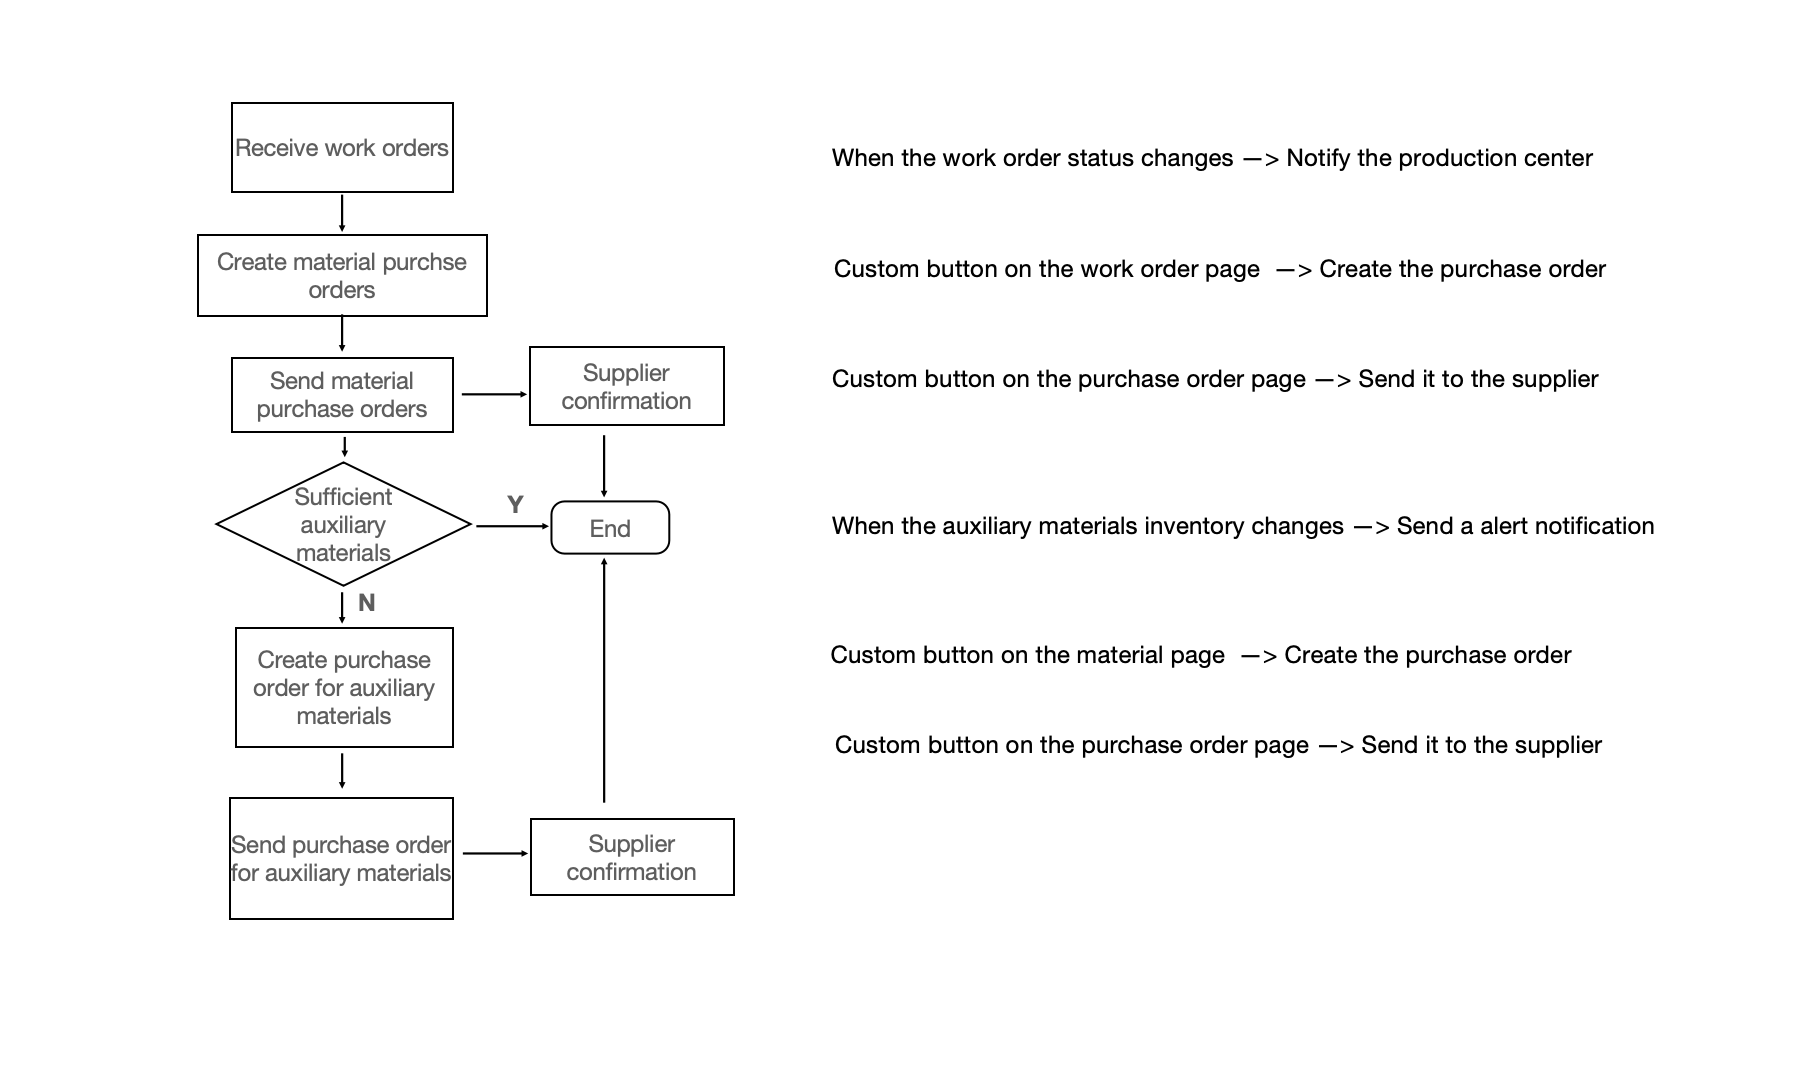
With roles and data touchpoints identified, we now dissect individual process to prepare for application design. Let’s unpack the “Purchase based on work order” process—one of five core processes—as an example.
This process is the business activity carried out by the Chef Assistant. This role receives work orders from the sales department and, places raw material purchase orders with suppliers, checks auxiliary materials inventory, deciding whether to replenish auxiliary materials. Each purchase process concludes with supplier confirmation.
On the right side of the flowchart, we can draft specific architectural content for each step. For example, the node for “Create material purchase orders” corresponds to the creation of a custom action (a type of workflow) on work orders.
Refine Architectural Deliverables and Blueprint
By systematically analyzing roles, processes, and data touchpoints, we generate actionable outputs for no-code application implementation:
- Data Structures as Worksheet Foundations: In this case, we have identified 13 data objects, including 4 details sub-tables. Create these as as worksheets, with relationships established between them.
- Create Views Based on Order Status: Multiple views can be created within the worksheets to reflect different stages of orders, such as “Draft Orders”, “Pending Orders”, and more.
- Custom Roles and Permissions: All internal and external roles involved in the system will be created as custom roles within the application, with permissions configured accordingly.
- Custom Page and Charts: The reports required by operational and managerial roles will serve as blueprints for creating custom pages, with chart components added to visualize the necessary data.
- Workflow Configuration: The business activities of each role, along with their associated processes, will guide the configuration of workflows. Some workflows will be manually triggered by users (via custom actions).
These five components form the foundational architecture required for application development. Starting from the roles involved, we have methodically broken down the tasks to create a detailed work plan. The time investment for this process depends on the scale of the project. While smaller applications for individual departments may not demand such rigorous analysis, mission-critical systems—like the core operations of this catering company—necessitate thorough architectural planning. Though no-code platforms reduce technical complexity compared to traditional coding, we strongly advocate for robust documentation practices. Clear documentation elevates application quality and significantly increases the likelihood of building it right the first time—minimizing rework and accelerating value delivery.
Application Implementation
Worksheets and Views
Within the application built by HAP implementation specialists below, different business processes are grouped (via the top menu). Each group houses corresponding worksheets tailored to operational needs. For example, the Product group includes worksheets for Series (Peoduct Categories), Products, Product Details, and Product Recipes.
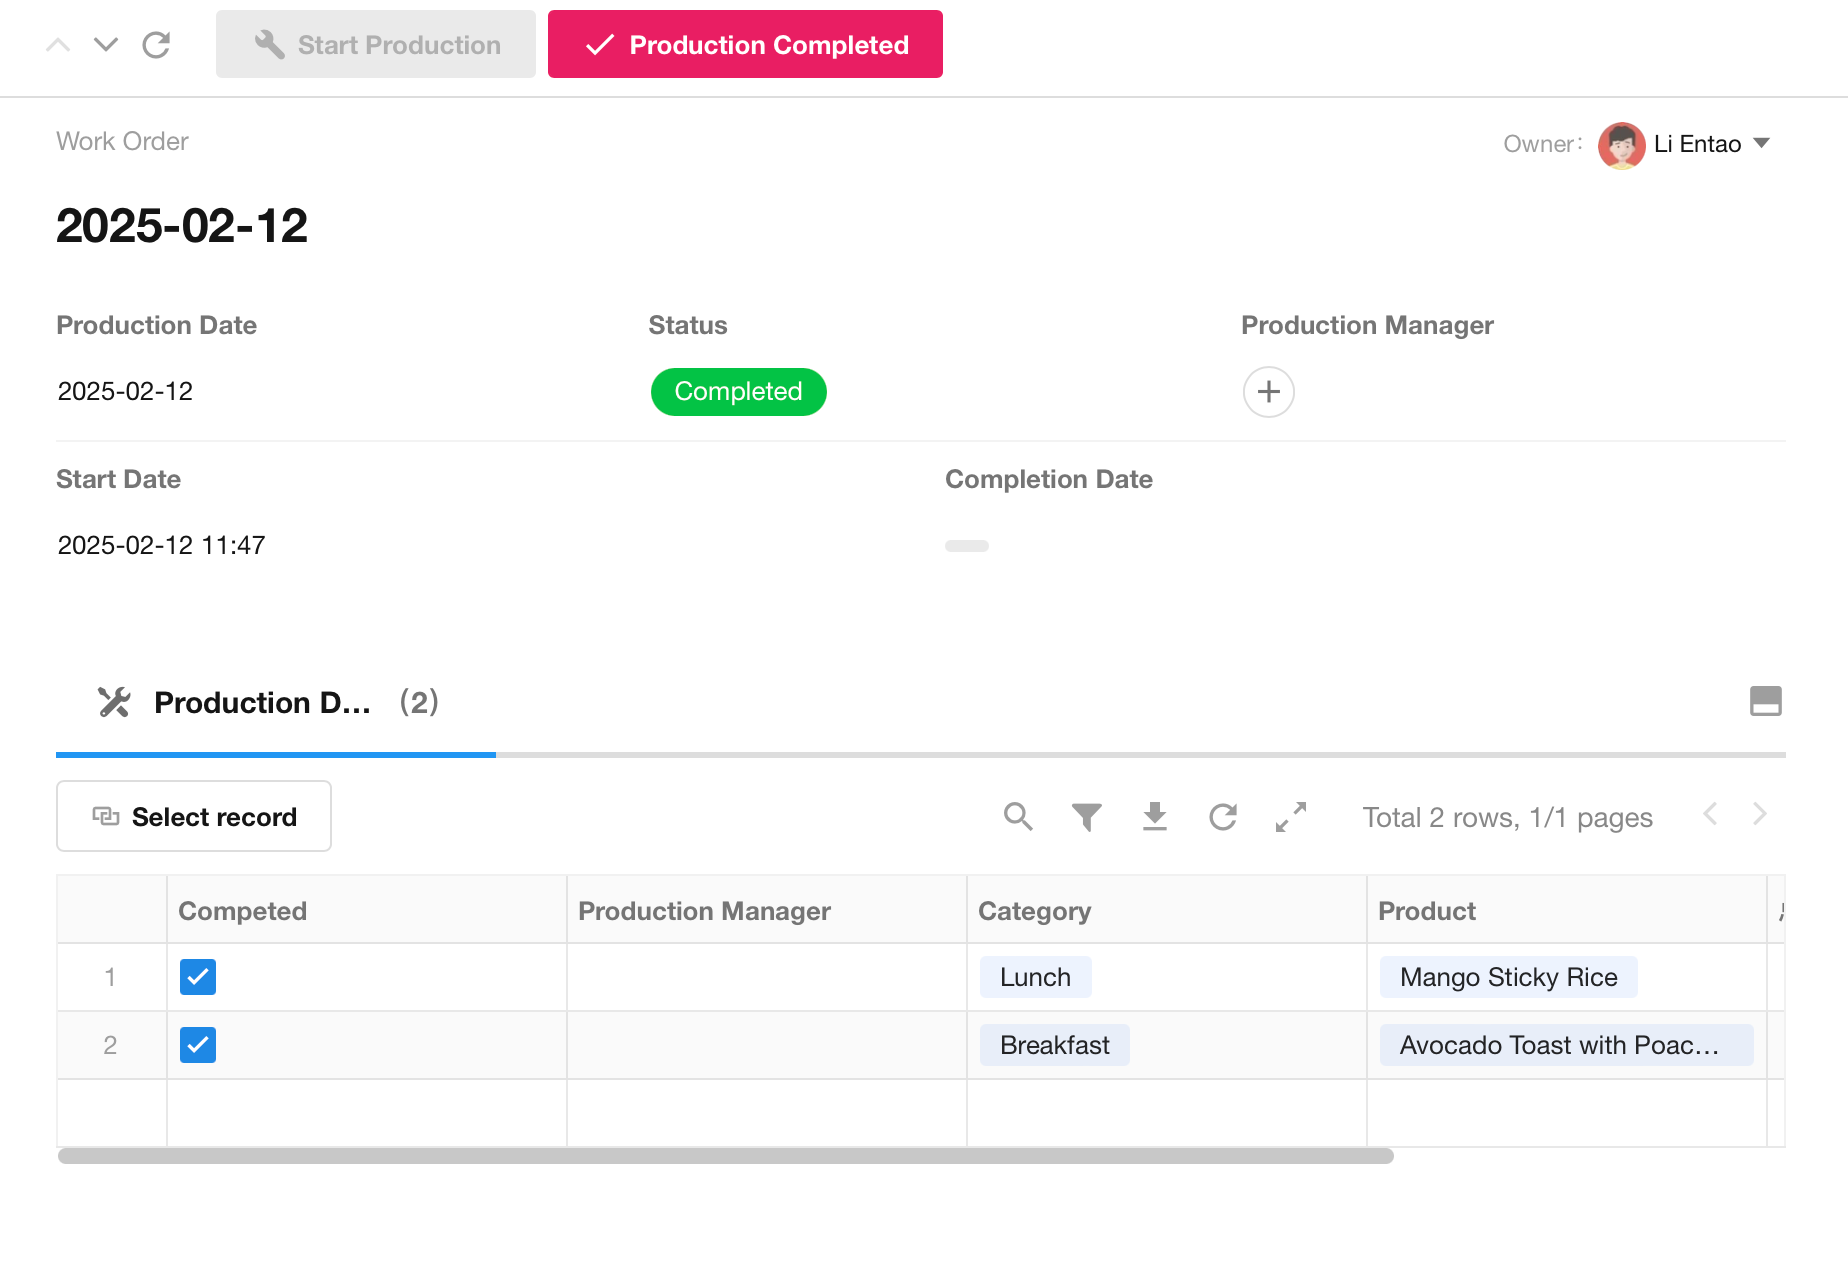
The Work Order—a core data object identified during architectural planning—is implemented with a subtable for Production Details. This structure ensures traceability and scalability, as shown below:
Roles
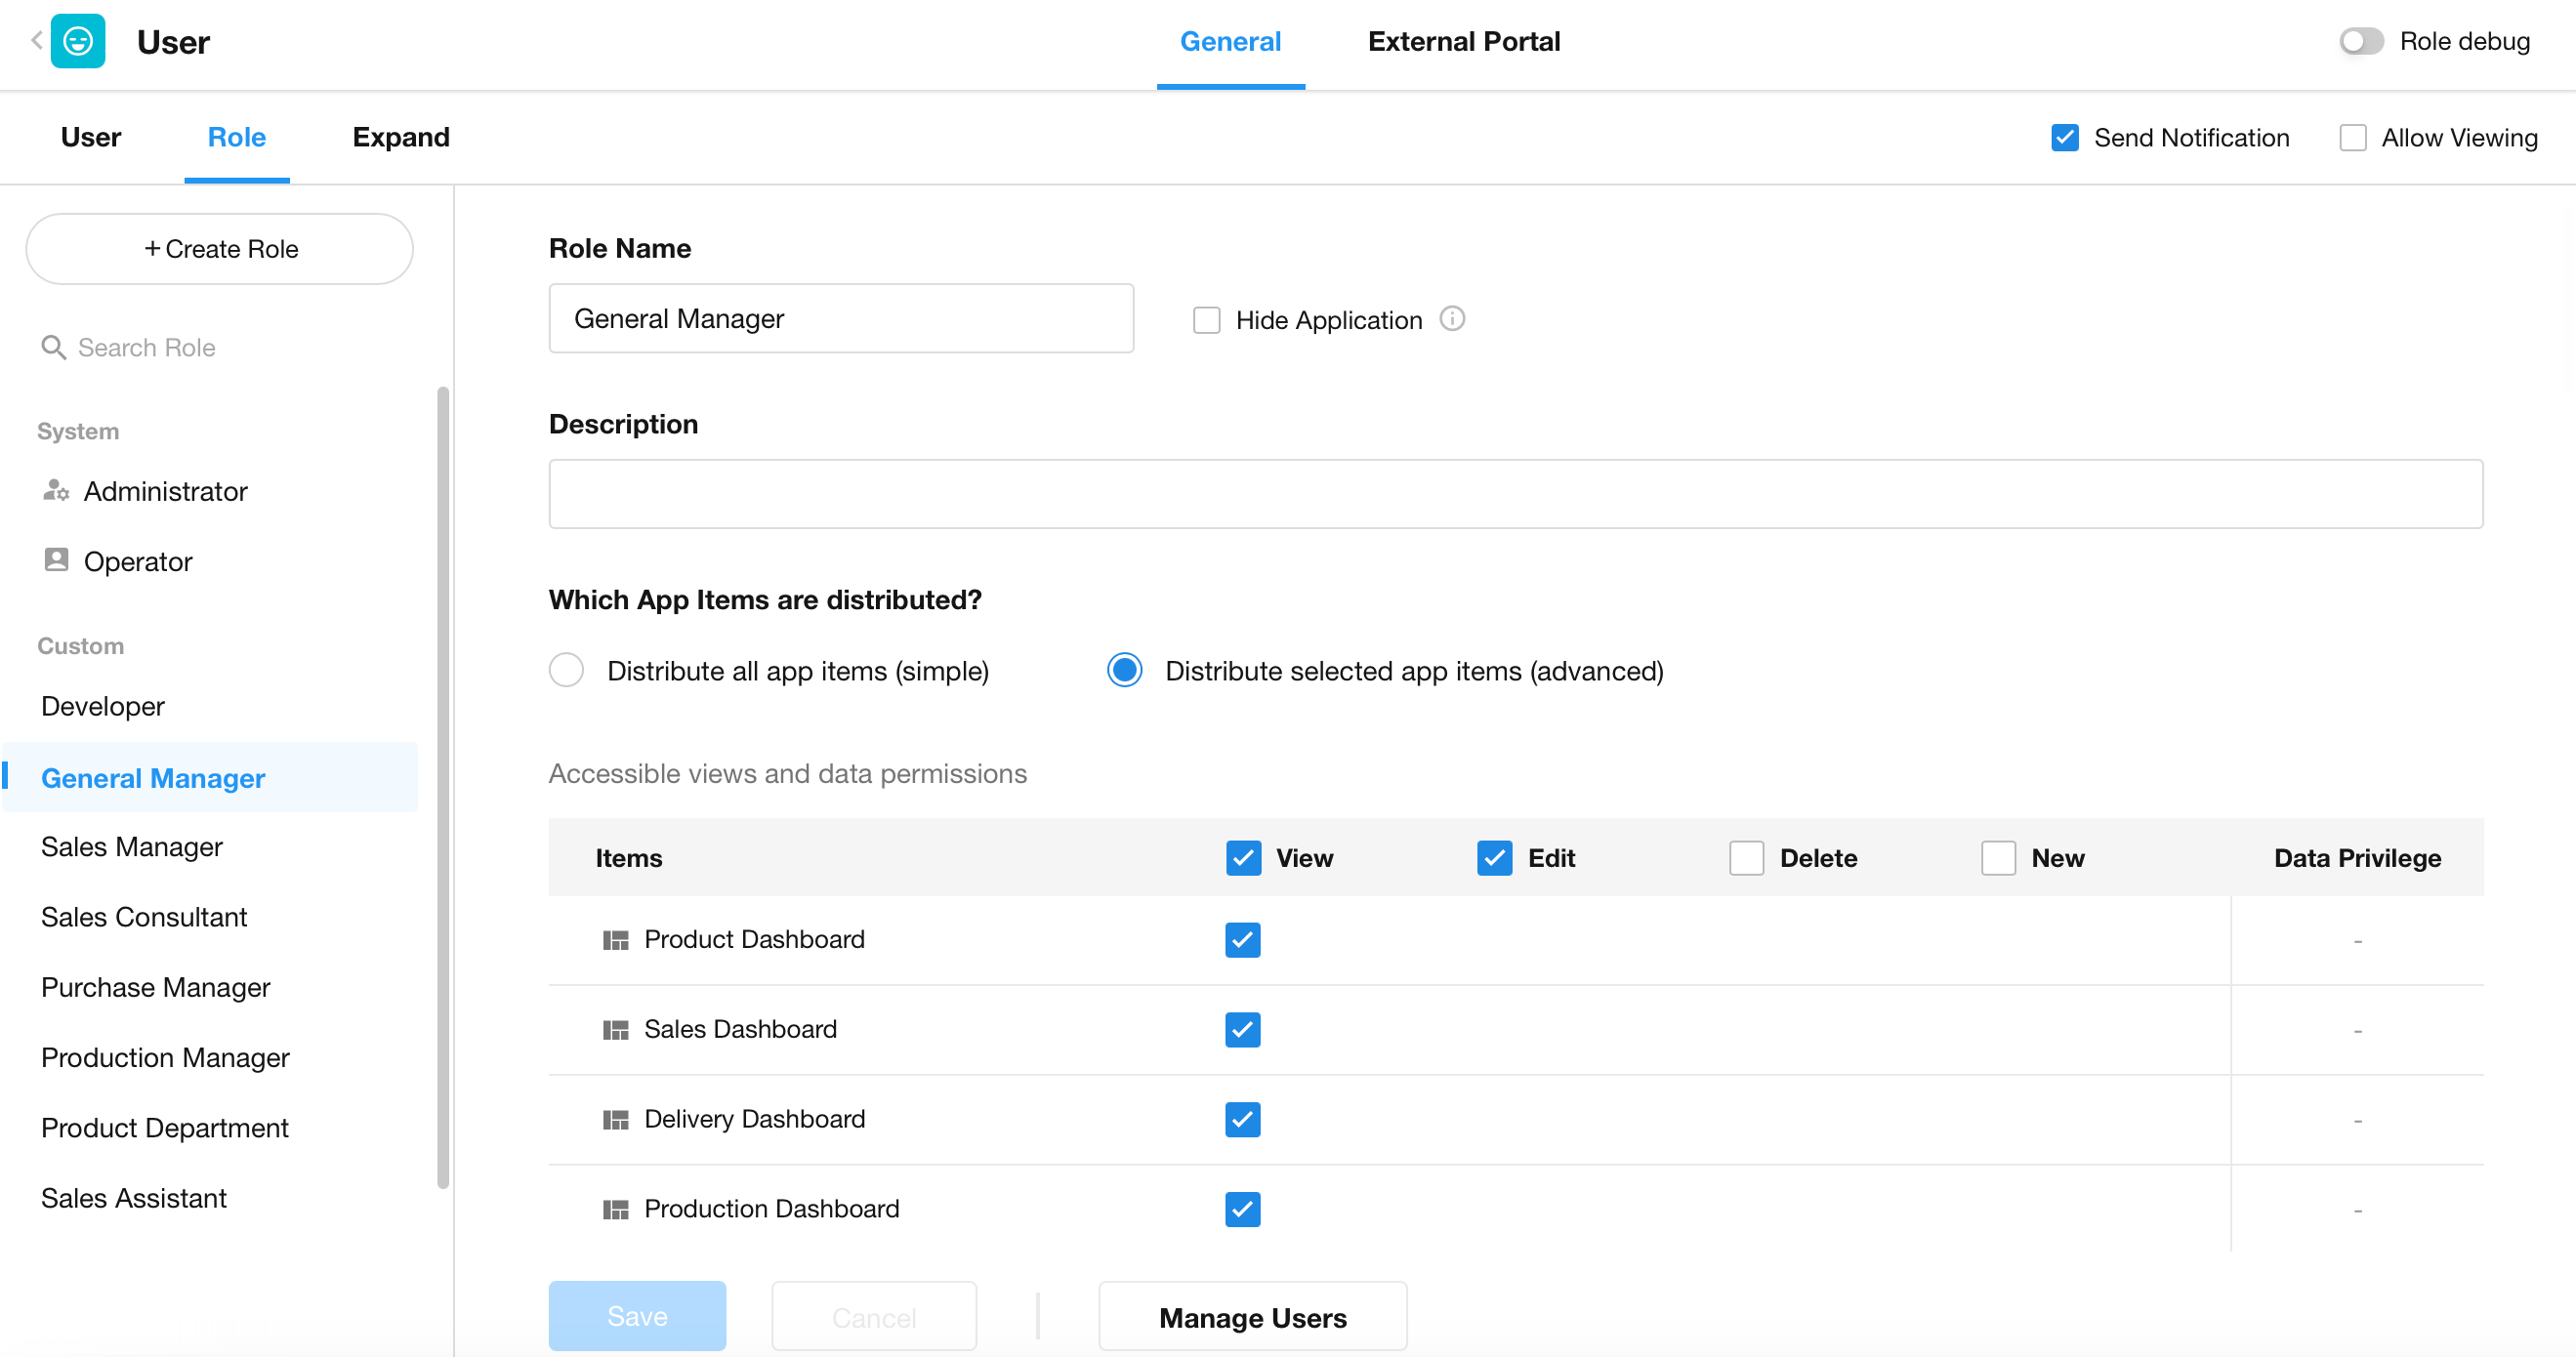
Roles, the cornerstone of RPIC, are translated into the platform as custom roles with granular permissions according to their data access needs. For instance:
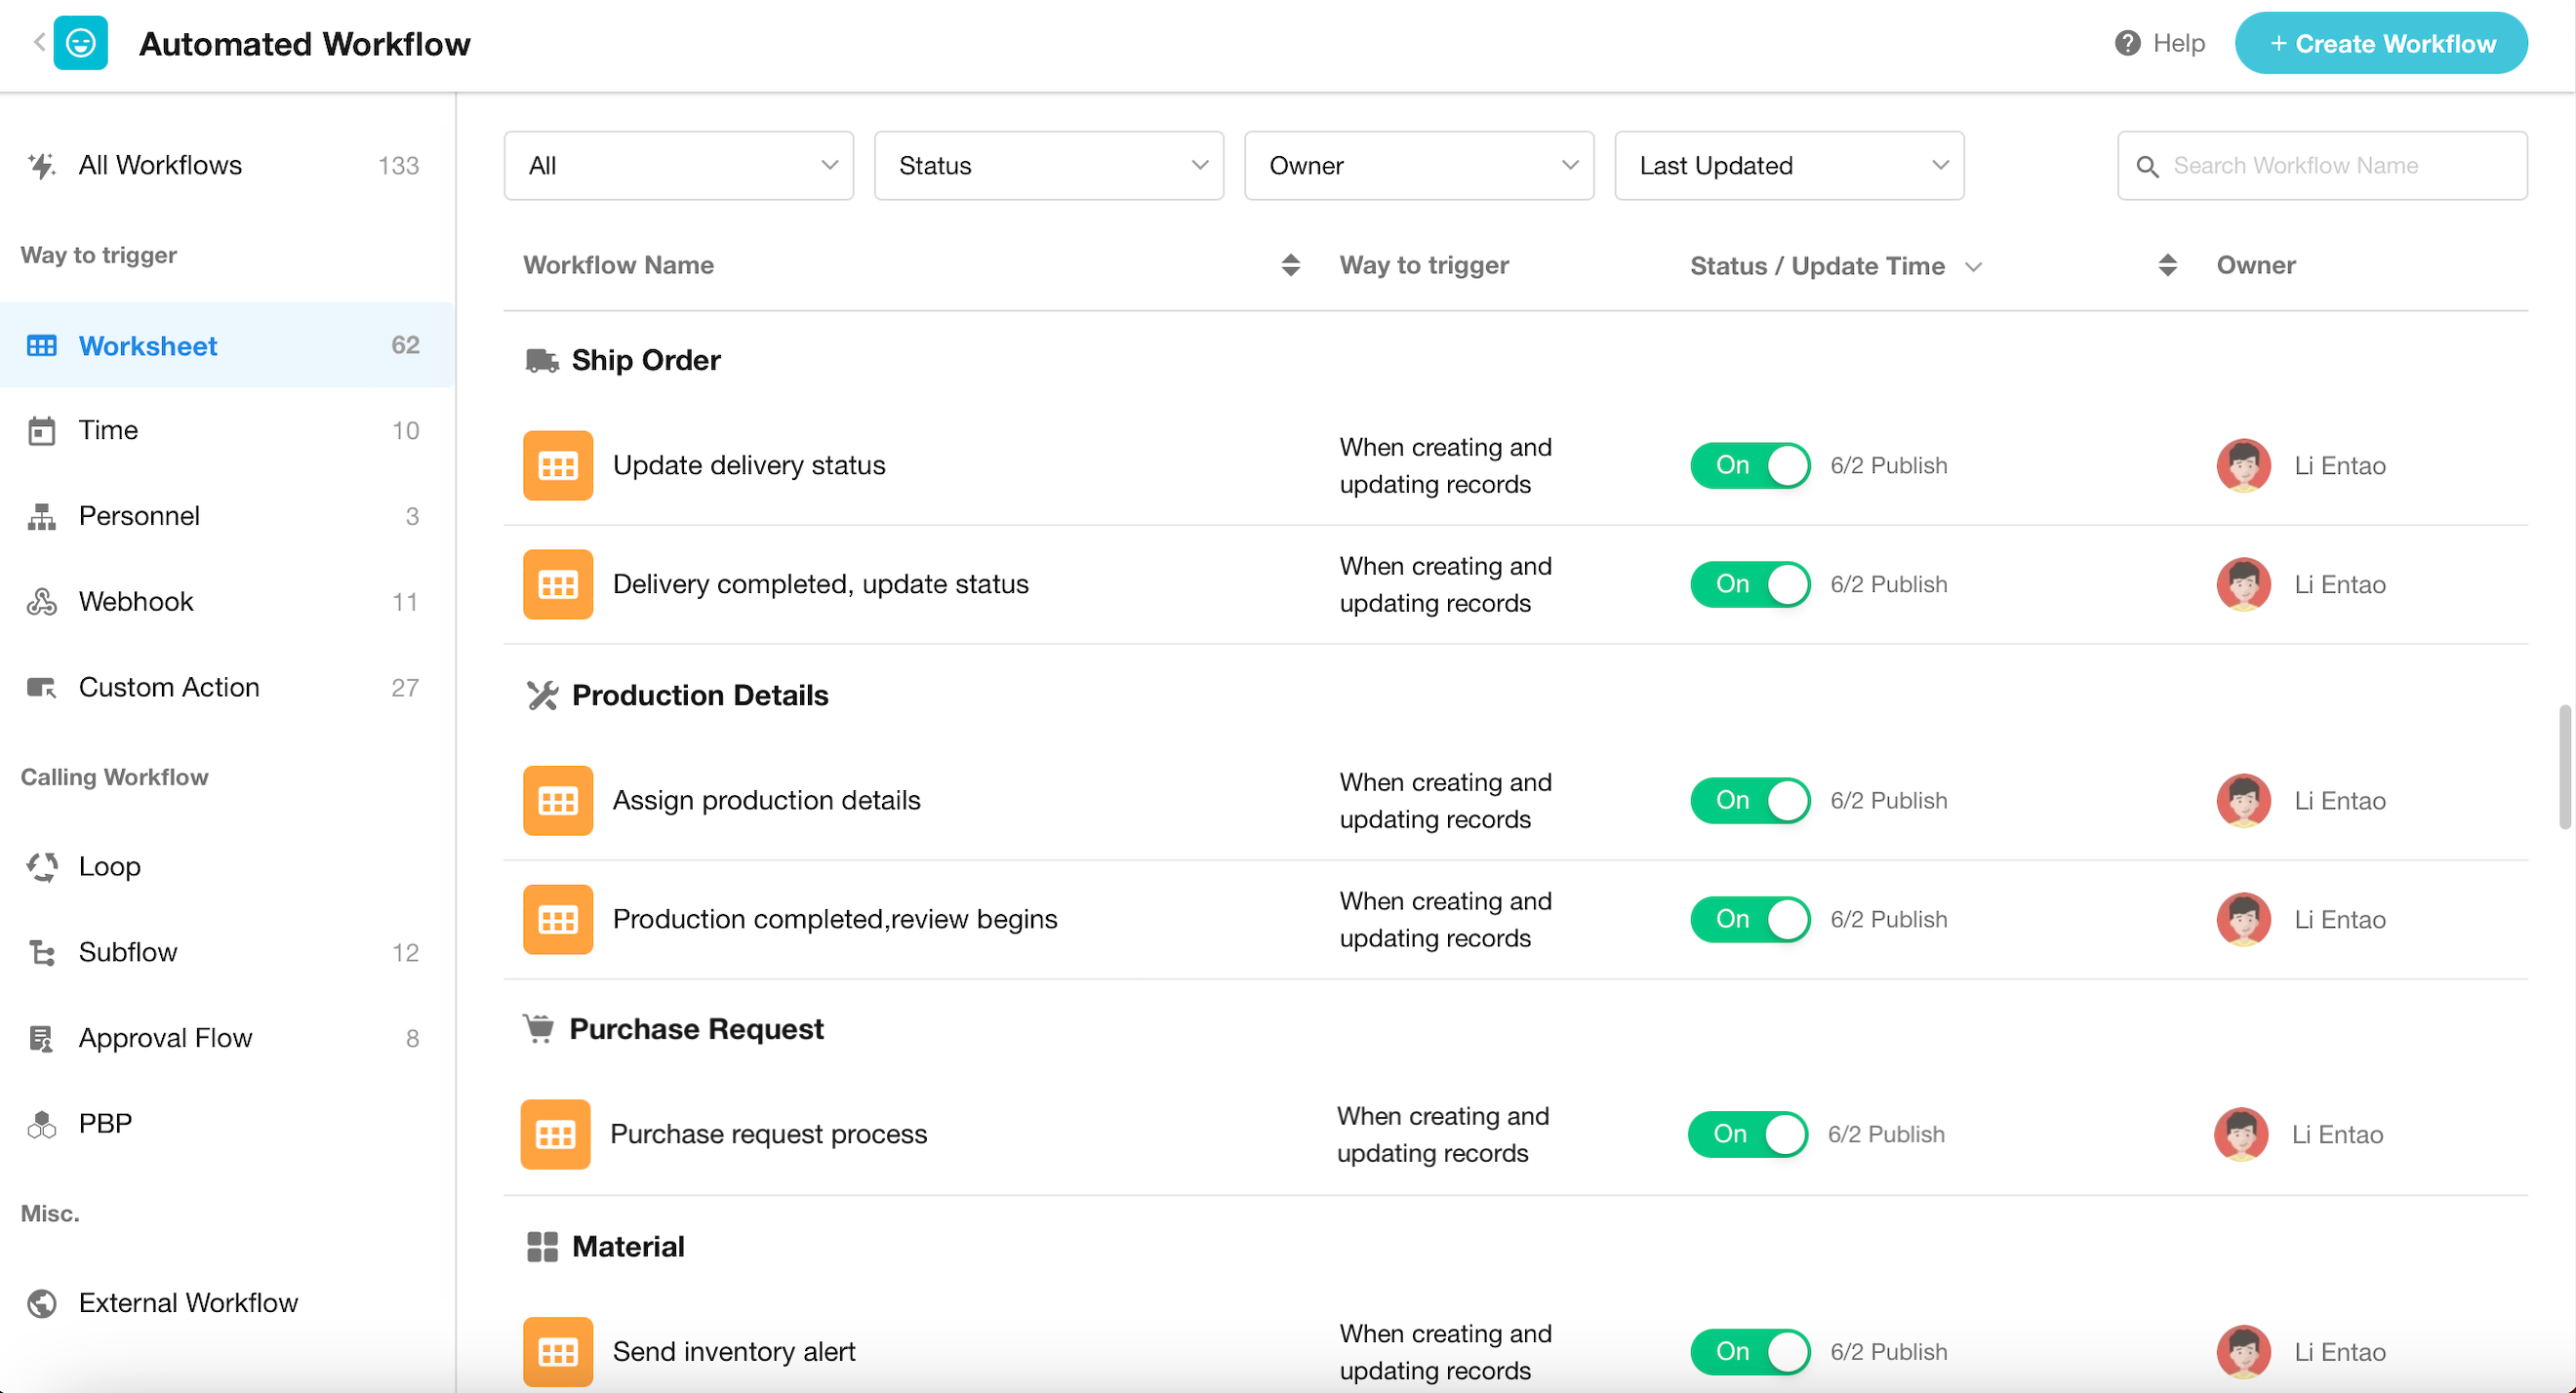
Workflows
In HAP, workflows are chains of triggers and action nodes that automate business processes. For example, the “Create work orders” workflow, it can be triggered via a custom button, and through data operation nodes, the relevant data from the sales order is mapped to a new work order. Below are the workflows configured for the entire system.
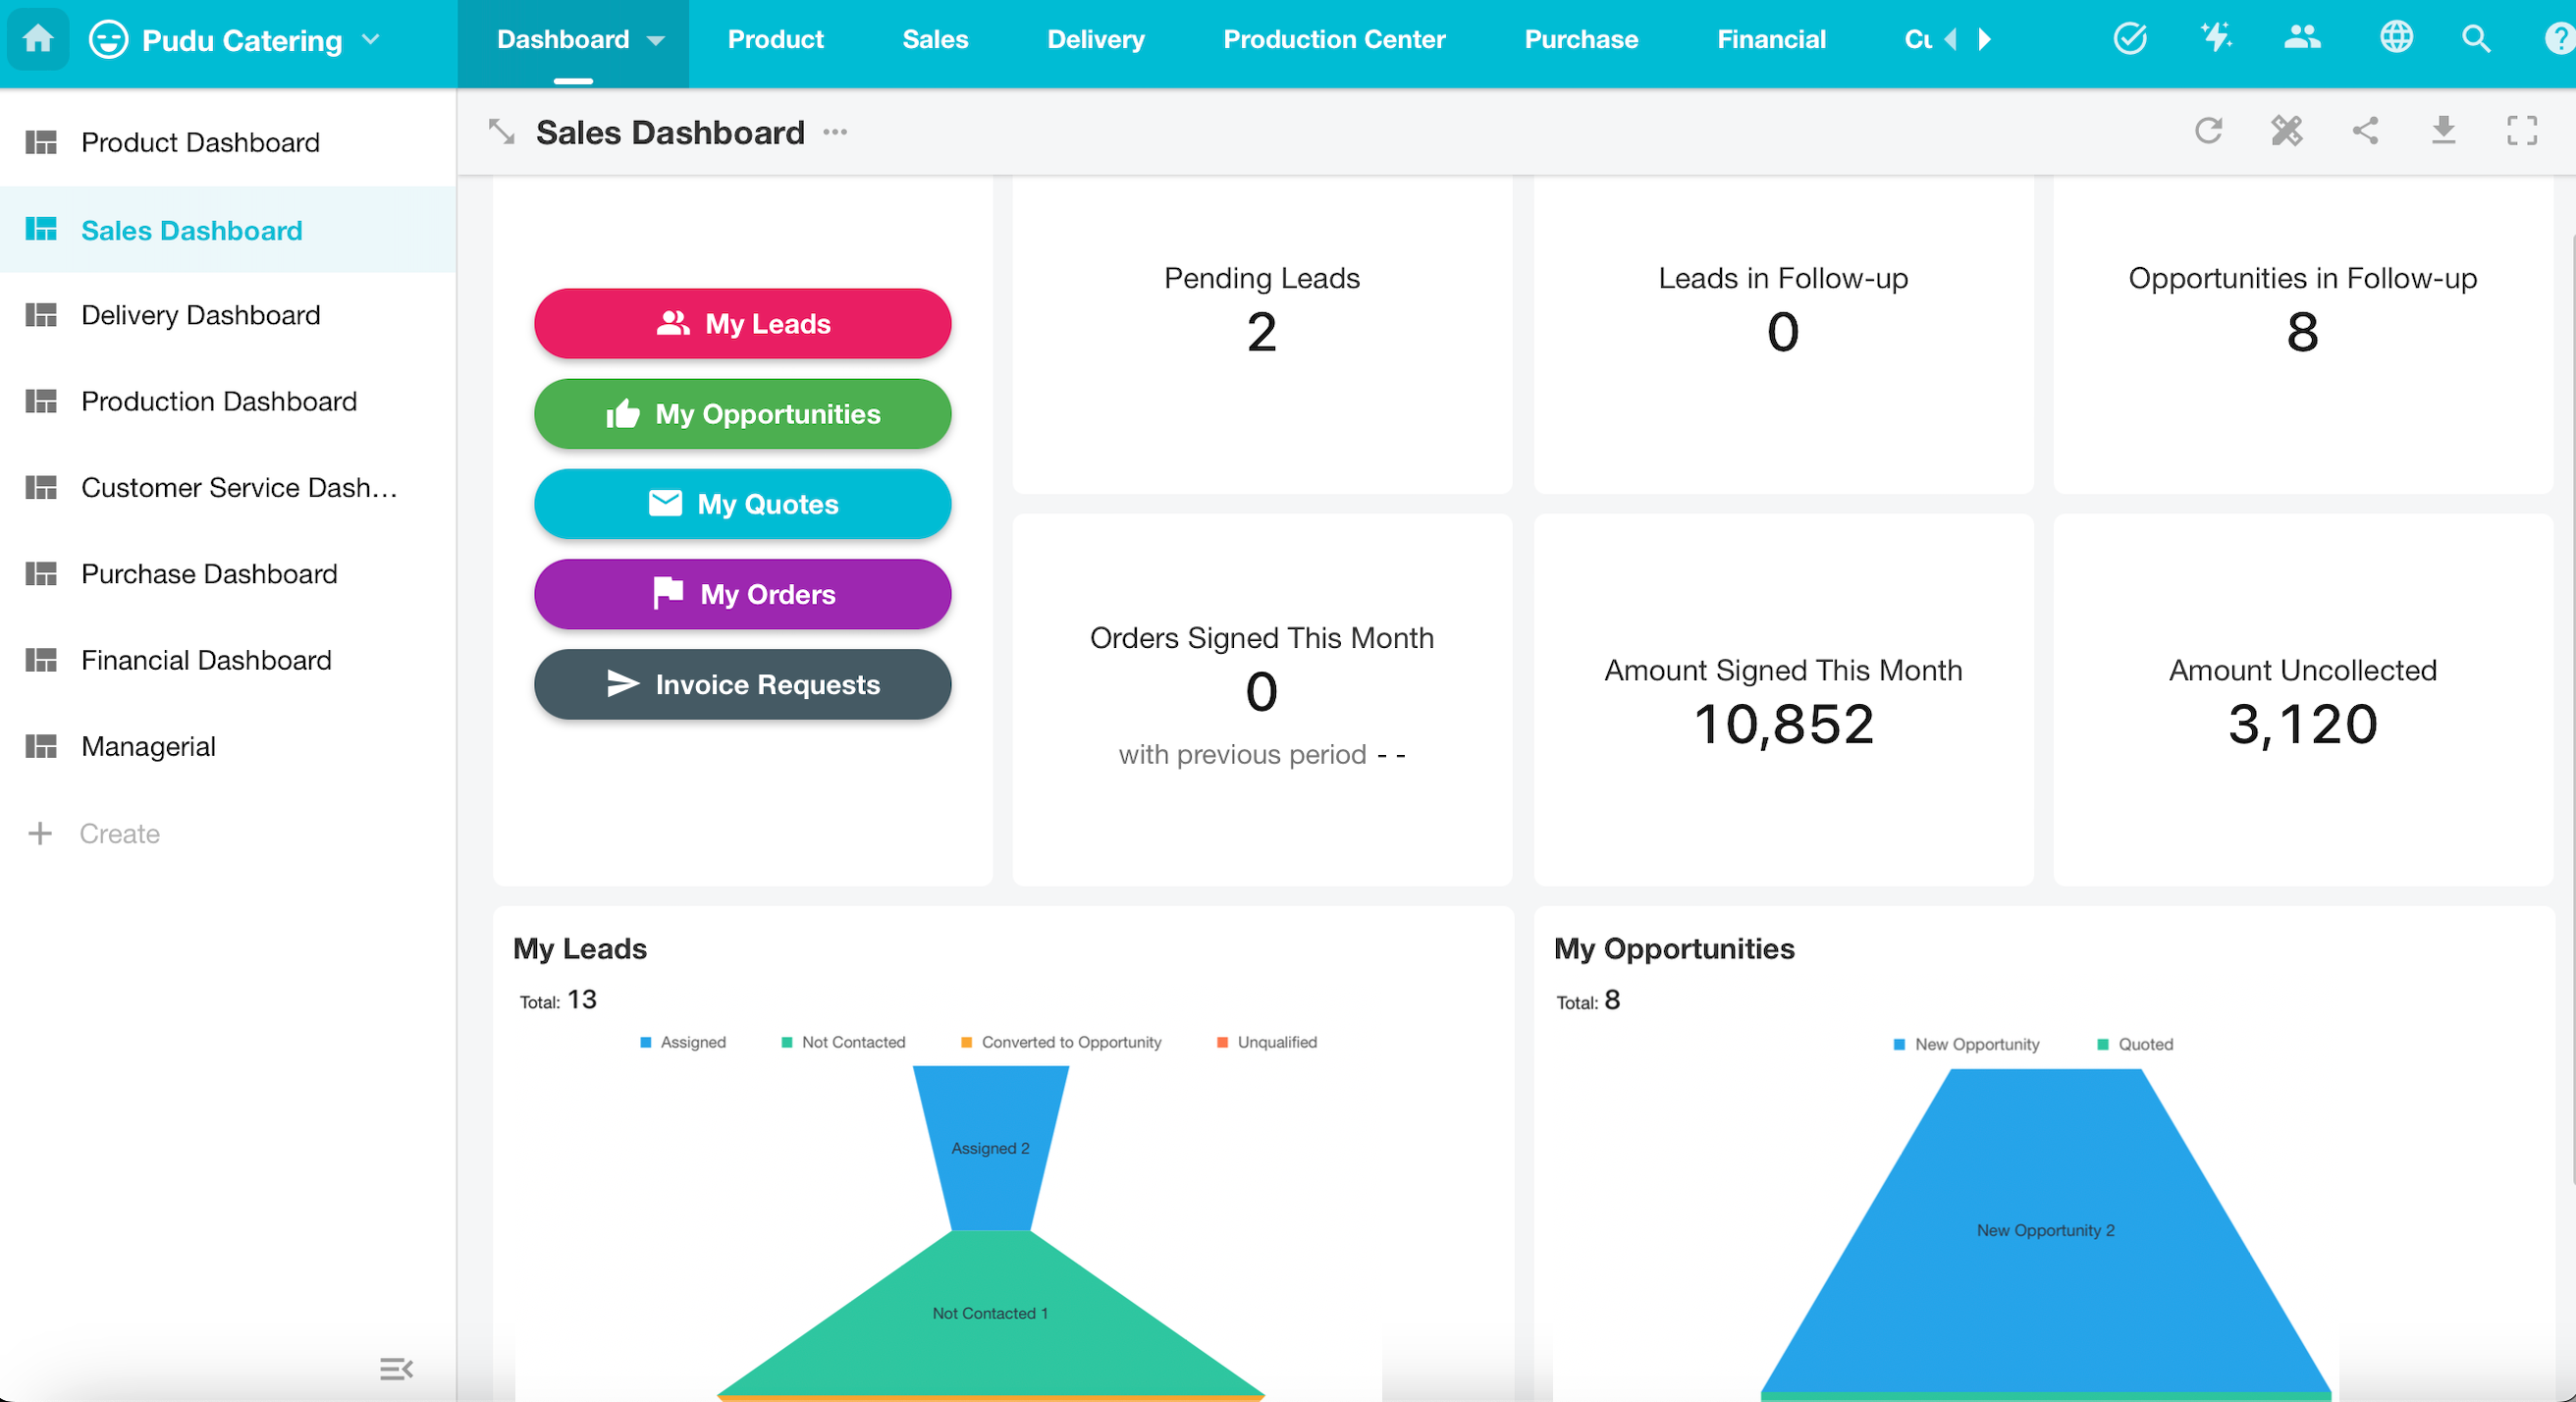
Custom Pages and Charts
To empower decision-making, role-specific custom pages consolidate critical metrics into visual dashboards. For example, in this application, multiple “Dashboard” pages are created, with different roles seeing different pages.
Explore More
With the foundational architecture in place, organizations can now leverage their blueprints to uncover untapped digital opportunities. Skipping architectural planning in favor of immediate application development risks myopic execution—innovation thrives on visibility. A well-defined architecture acts as both a canvas and a compass, enabling leaders to ideate, validate, and scale transformative solutions.
Extending to Comprehensive Business Processes
While the case study focused on Pudu Catering’s order-to-delivery cycle (order intake, purchase, production, and logistics), a holistic enterprise operation encompasses broader functions: marketing, sales conversion, customer service, and HR performance management. No-code platforms excel here by inherently connecting systems, eliminating data silos that plague fragmented technical stacks. For instance, integrating customer service with existing order and customer data ensures seamless experiences while maintaining unified governance—a critical advantage of HAP, where cross-application data relationships enforce enterprise-wide consistency.
When expanding business processes, organizations should prioritize core value-creation processes. For Pudu, this centers on meal preparation and delivery. Once core processes are optimized, extend digitization to administrative and enabling processes (e.g., HR, finance).
Invest in unique digital capabilities within the core value chain. For example, Pudu could automate purchase and inventory management to achieve a zero-inventory model, cementing cost leadership in the corporate catering market. Supporting functions, however, need only match industry standards—save innovation bandwidth for competitive differentiators.
Customer-Centric Service Extensions
The current case study omits customer experience design—a critical frontier for innovation. For Pudu, this might include developing an online self-service portal allowing customers to place orders, save favorite menus, and track order status in real time. Automate SMS updates at key milestones (e.g., “Your order is now in production” or “Meals have been handed to logistics”). Or enable direct chef interactions for special requests, turning transactional exchanges into memorable experiences.
The potential for customer experience innovation is boundless. Organizations can adopt a reverse-engineering approach: identify customer frustrations (e.g., logistical opacity) and design digital interventions to resolve them. Every feature should answer the question: Does this enhance customer value or streamline their journey?
Automation
Automation shifts rule-based tasks from humans to programmed systems. While theoretically achievable with sufficient data and custom code, traditional automation often requires costly cross-functional collaboration between business teams and developers.
No-code application platforms empower business users to independently develop these complex automation features—or more accurately, configure them visually without writing code. For Pudu, it automatically get daily material purchase orders by analyzing customer order details, eliminating error-prone manual calculations. This precision replaces chefs’ historical reliance on intuition for bulk procurement—a leap in accuracy and internal control. Further opportunities abound: production centers could auto-generate logistics orders based on production status, or batch-create daily delivery manifests.
Data-Driven Insights
Operational data unlocks transformative insights. Pudu Catering could:
- Optimize menu combinations through customer order pattern analysis
- Refine pricing via price sensitivity testing
- Align staffing schedules with delivery time demand trends
With unified data, generating actionable reports requires no expensive BI tools. No-code platforms enable intuitive, Excel-like dashboard creation, empowering teams to turn data into decisions effortlessly.
Scaling for Growth
A primary driver of digital investment is scalability. While small teams might manage with spreadsheets and ad-hoc communication, growth inevitability demands robust systems.
Scaling extends beyond headcount. More complex scaling strategies involve the introduction of multiple operational entities. Pudu Catering might expand to multiple production centers within a city to reduce delivery costs or scale nationally. A centralized digital system becomes exponentially more valuable here, amortizing costs across locations. By adding “operational city” and “production center” entities to its existing data architecture, Pudu can rapidly adapt its application for multi-site use—all predicated on forward-looking architectural design—what this article focuses on.